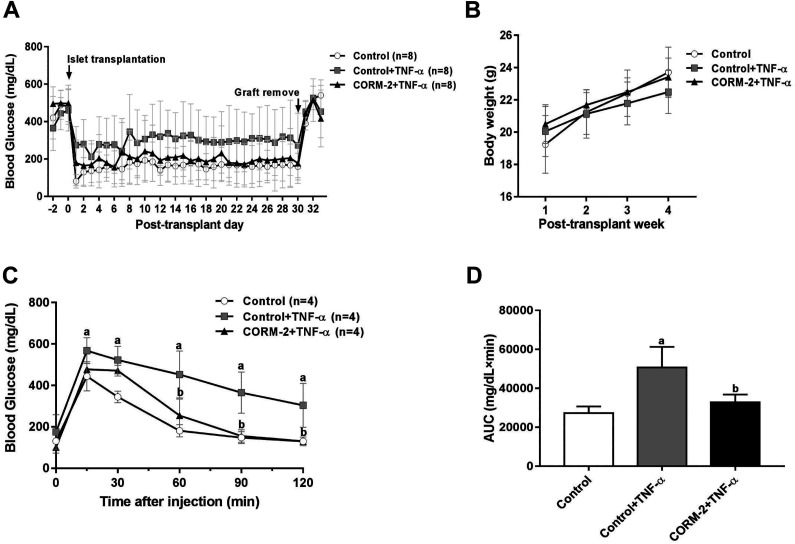
Fig. 5.
Evaluation of islet function in vivo of TNF-α-treated islets that were isolated with or without CORM-2 pretreatment. (A, B) Results of blood glucose (A) and body weight (B) measurements (n = 8). (C) Blood glucose levels of mice in IPGTT on day 14. (D) Area under the curve of blood glucose levels of mice in IPGTT on day 14. Data are shown as mean ± SD. a P < 0.05: control group vs control + TNF-α group; b P < 0.05: CORM-2 + TNF-α treatment group vs control + TNF-α group (one- (D) or two-way (C) ANOVA with post hoc Tukey’s test). CORM-2: carbon monoxide-releasing molecule 2; IPGTT: intraperitoneal glucose tolerance test; TNF-α: tumor necrosis factor-α.

