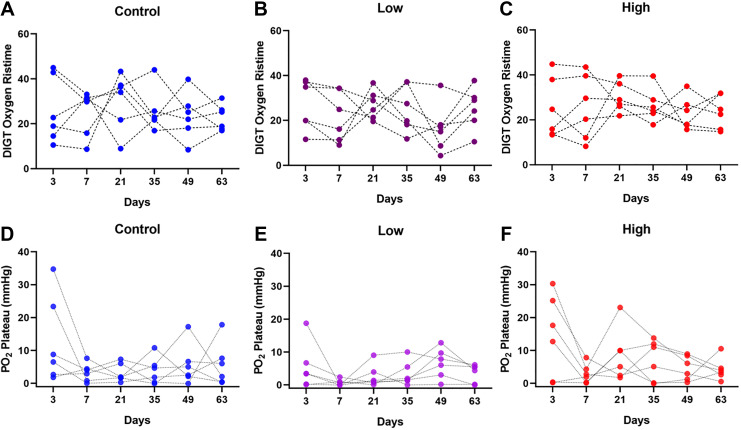
Figure 3.
(A–C) DIGT Oxygen Risetime (minutes) and (D-F) PO2 plateau value (mmHg) at the end of each DIGT experiment, measured for three groups: control (saline), low (25 μmol/kg body weight) and high (50 µmol/kg body weight) NaHS dosages (n = 6 per group). All groups underwent twice daily injections for the first 28 days followed by 35 days without injections (day 28 to 63). No statistical differences in Risetime or PO2 plateau values were detected between groups.

