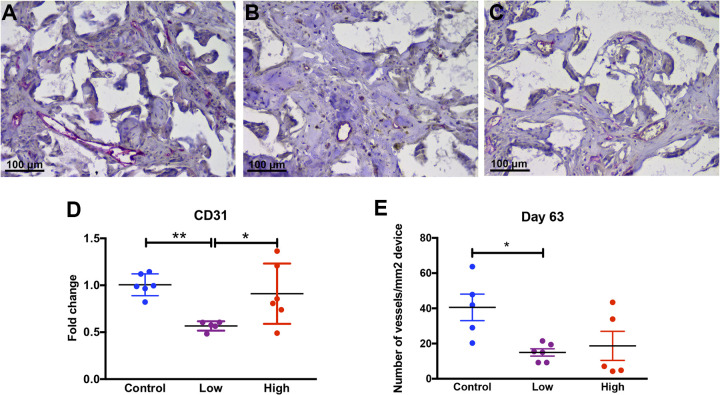
Figure 4.
Histological analysis of blood vessels after 63 days of implantation. Blood vessels in the control (A), low H2S dosage (B), and high H2S dosage (C) treated groups were stained by using the endothelial cell marker CD31 (pink color). (D) Gene expression of the endothelial cell marker CD31 after 63 days of implantation and (E) the number of vessels per area (mm2) in each device was measured. Data is plotted as mean with the standard error of mean. Statistical analysis was carried out using a one-way ANOVA with a Tukey post-hoc test, p < 0.05 (*) and p < 0.001 (**).

