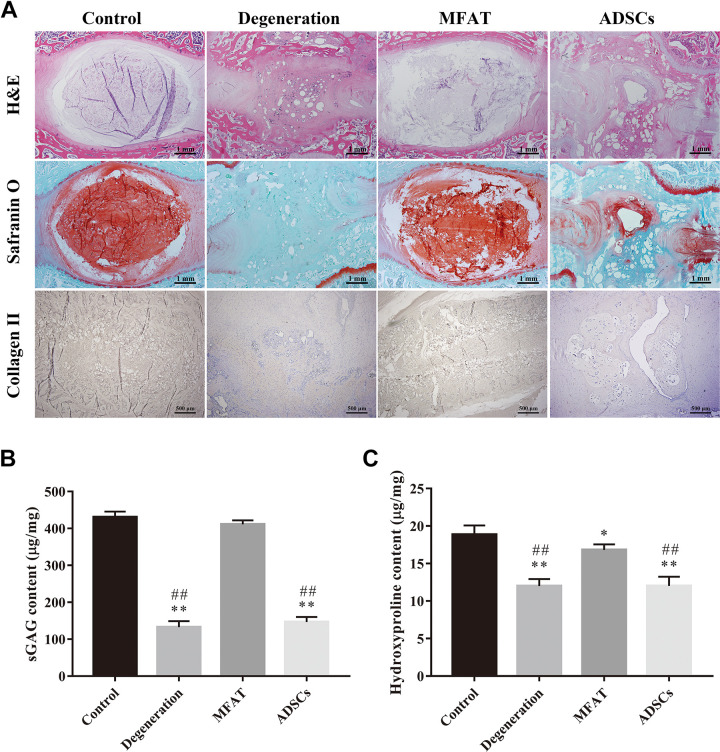
Figure 6.
Histological, immunohistochemical, and biochemical analysis of the NP. Representative (A) H&E and Safranin O staining of disc samples from each group at 16 weeks after injection. Scale bar = 1 mm. Immunohistochemical detection of collagen II in the NP from the control, degeneration, MFAT, and ADSCs groups at 16 weeks after injection. Scale bar = 500 µm. The contents of (B) sGAG and (C) hydroxyproline in each group at 16 weeks after injection were quantified. Data represent mean ± SEM; N=6; *p < 0.05, **p < 0.01, vs. control group; ## p < 0.01, vs. MFAT group.

