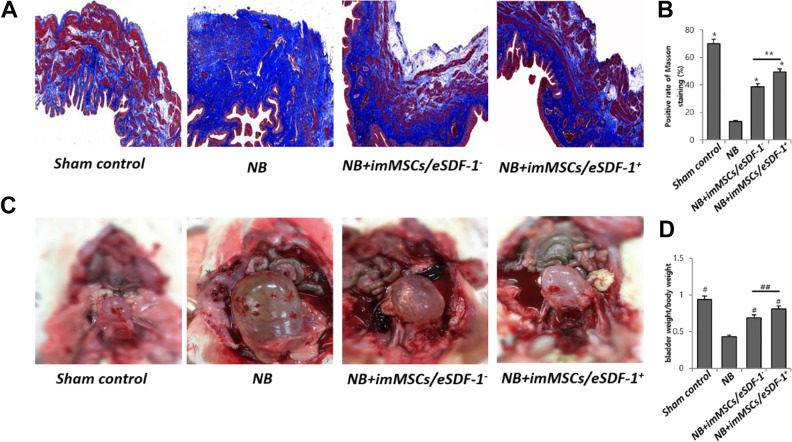
Fig. 3.
(A) Representative images of Masson Trichrome stain for each group. Red is smooth muscle, and blue is collagen. Original magnification: ×200. (B) Percentage area of smooth muscle for each group. Each bar shows the mean values (standard deviation). *P < 0.01 compared with NB group. **P < 0.05 compared with NB+imMSCs/eSDF-1− group. (C) Image of rat’s bladder in each group after fasting water for 2 h. (D) Bladder, weight/body weight ratio of each group in mg/g. # P < 0.01 compared with NB group. ## P < 0.05 compared with NB+imMSCs/eSDF-1− group. imMSC: immortalized mesenchymal stem cell; NB: neurogenic bladder; SDF-1: stromal cell-derived factor-1.

