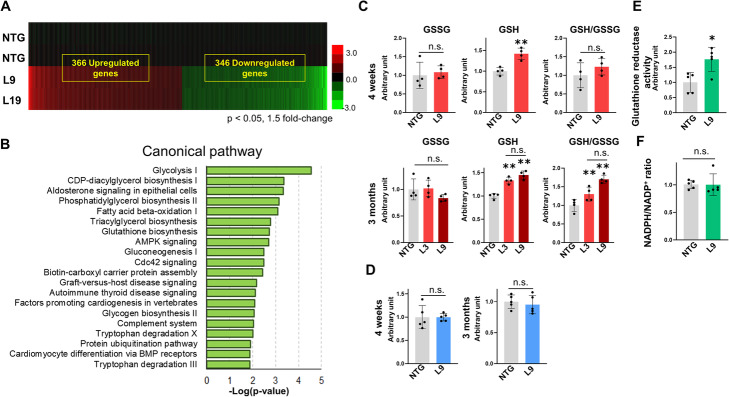
Fig. 4.
cDNA microarray examination and redox analysis of αMHC/miR-143/145TG mice. a Fold changes in gene expression over the average of the male NTG control mice are as indicated on the scale bar, where red indicates upregulation and green indicates downregulation. The number of genes > 1.5-fold differentially expressed in male L9 and L19 mice over control NTG are indicated. b Gene ontology classification of genes differentially expressed at least 1.5-fold in male L9 and L19 mice compared to the NTG control. The top twenty most significant canonical pathways in L9 and L19 mice are shown. c GSSG, GSH and GSH-to-GSSG ratio of 4-week and 3-month old male L3 and L9 mice. The results are presented as the means ± SD. Significance was assessed with unpaired t-test or one-way ANOVA followed by a post hoc Tukey test (n = 4; **p < 0.01 vs. NTG). d TBARS assay of 4-week and 3-month old male L9 mice. The results are presented as the means ± SD. Significance was assessed with unpaired t-test (n = 5). e Glutathione reductase assay of 3-month-old male L9 mice. The results are presented as the means ± SD. Significance was assessed with unpaired t-test (n = 5). f NADPH/NADP+ assay of 3-month old male L9 mice. The ratios of NADPH to NADP+ are shown. The results are presented as the means ± SD. Significance was assessed with unpaired t-test (n = 5). c–f Similar results were obtained in at least two independent experiments

