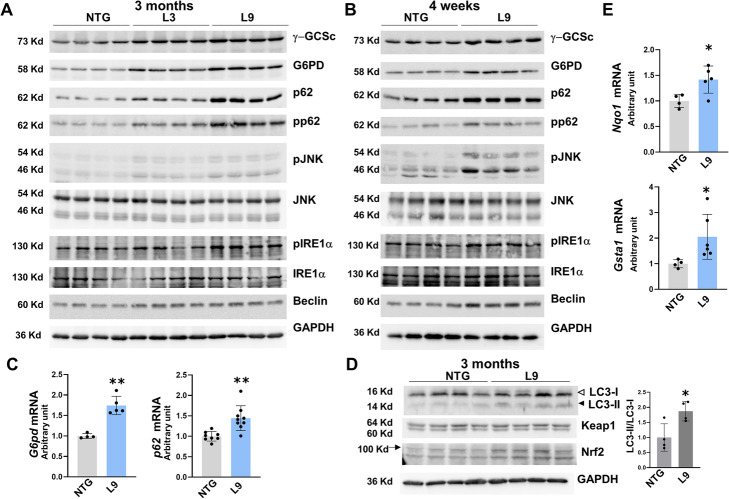
Fig. 5.
Analysis of expression of stress-induced molecules. a Western analysis of the hearts of 3-month old male L3 and L9 mice. b Western analysis of the hearts of 4-week old male L9 mice. c Quantitative RT-PCR analysis of G6pd and p62 in the hearts of 3-month old male L9 mice. The results are presented as the means ± SD. Significance was assessed with unpaired t-test (n = 4 ~ 9; **p < 0.01 vs. NTG). d Western analysis of the hearts of 3-month-old male L9 mice. The white and black arrowheads respectively indicate LC3-I and LC3-II. An arrow indicates Nrf2. The right panels show relative densitometric analysis of the western blot of LC3. The results are presented as the means ± SD. Significance was assessed with unpaired t-test (n = 4; *p < 0.05 vs. NTG). a, b and d: Whole cell extracts were examined with the indicated antibodies. e Quantitative RT-PCR analysis of Nqo1 and Gsta1 in the hearts of 3-month old male L9 mice. The results are presented as the means ± SD. Significance was assessed with unpaired t-test (n = 4 ~ 6; *p < 0.05 vs. NTG). a–e Similar results were obtained in at least two independent experiments

