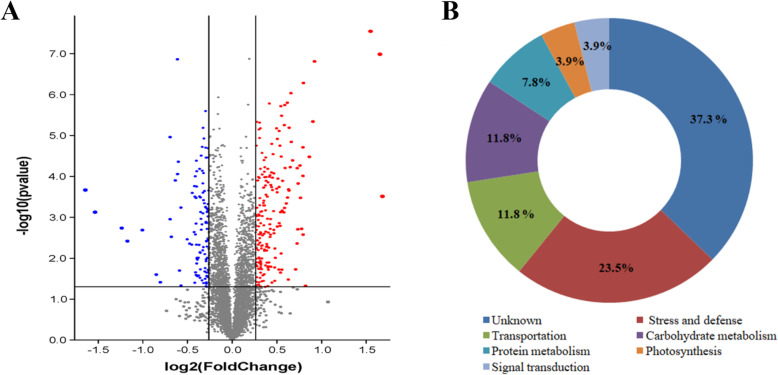
Fig. 5.
Volcano plot (a) and functional categorization (b) of the identified proteins based on iTRAQ proteomics. The iTRAQ proteomics is performed on leaves of BSMV-VIGS-TaCPK34- or BSMV-VIGS-GFP-inoculated wheat plants suffering drought stress for 14 days. And the different colors of circles represent that there were significant difference between samples, the blue circle represents down-regulated proteins, red circle represents up-regulated proteins, grey circle represents none-regulated (not significant difference of samples) proteins, respectively

