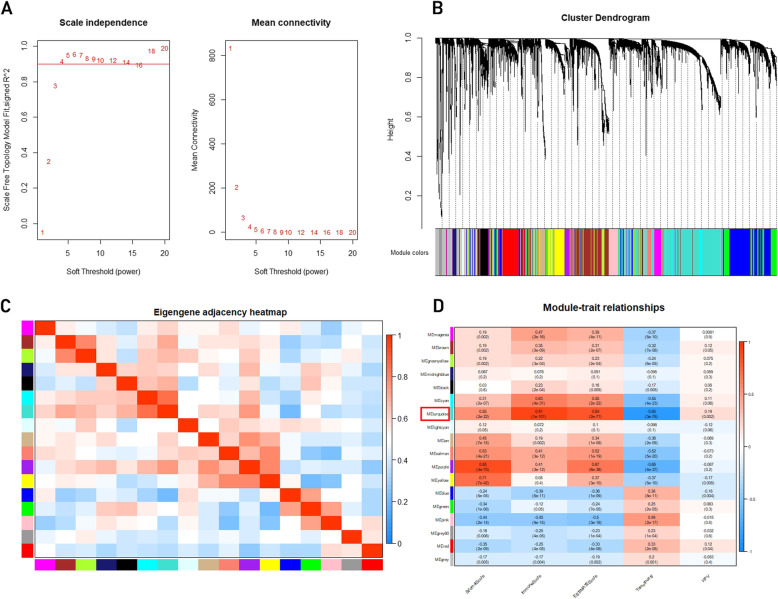
Fig. 1.
Construction of co-expression modules and identification of clinically significant modules. a) Analysis of the scale-free fit index and mean connectivity for different soft thresholding powers, and four was the most fit power value. b) The cluster dendrogram of top 25% genes ranked by SD from large to small in GSE65858. Each branch represents one gene, and each color represents one co-expression module. c) Heatmap of the correlation between module eigengenes (MEs) and the clinical features of HNSCC samples. d) The turquoise module was selected as the most significant module for further analysis

