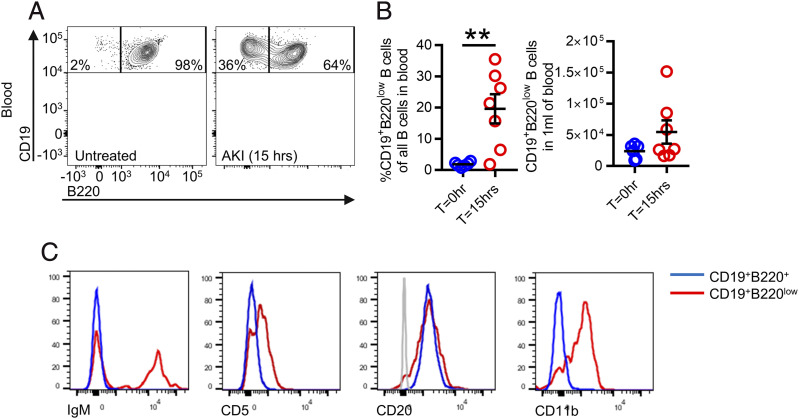
FIGURE 2.
During AKI, a population of CD19+B220low B cells is observed in the blood. (A) Representative flow cytometry chart of blood for healthy and AKI mice, gated on single, live, in vitro CD45+CD19+ events. (B) Quantification of percentage of CD19+B220low B cells relative to all CD19+ B cells (left) and absolute number of CD19+B220low B cells per 1 ml of blood in healthy mice and 15 h after FA-AKI mice. Right, (n = 13) male mice in total; parametric unpaired t test was used. (C) Representative histograms of other common B cells markers on blood CD19+B220+ and CD19+B220low B cells 15 h following FA-AKI. Gray histogram in CD20 graph represents a negative population. **p < 0.01.

