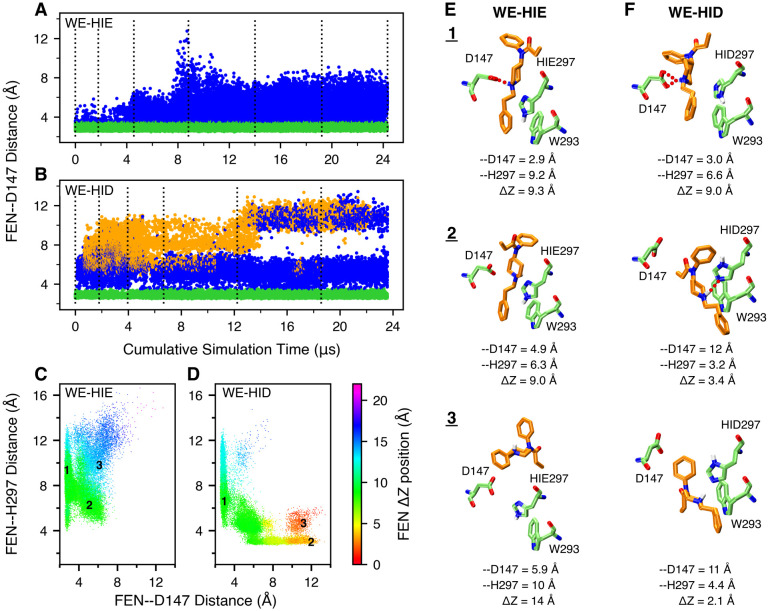
Figure 2. Fentanyl visits the D147-binding mode in the presence of HIE297 but both D147- and H297-binding modes in the presence of HID297.
A, B. The FEN-D147 distance, referred to as the minimum distance between the piperidine nitrogen and the carboxylate oxygen of Asp147, as a function of the cumulative WE simulation time in the presence of HIE297 (A) or HID297 (B). Data with the FEN-D147 and FEN-H297 distances below 3.5 Å are colored green and orange, respectively, and otherwise blue. The unweighted data from all bins were taken and the time refers to the cumulative time. The dotted vertical lines are drawn at every 50 WE iterations. C, D. FEN-H297 vs. FEN-D147 distance from the WE-HIE (C) and WE-HID (D) simulations. The data points are color coded by the fentanyl ΔZ position, defined as the distance between the centers of mass (COM) of fentanyl and mOR in the z direction. N- (52–65) and C-terminal (336–347) residues of mOR were excluded from the COM calculation. The FEN-H297 distance is measured between the piperidine nitrogen and the unprotonated imidazole nitrogen of His297. Three groups of data (labeled in the plots) taken from the last 50 iterations of each simulation were subjected to the hierarchical clustering analysis. For WE-HIE, the three groups were defined as FEN–D147 distance ≤ 3.5 Å; FEN-D147 distance ≥ 4 Å and FEN–H297 distance ≤ 8 Å; and FEN–D147 distance ≥ 4 Å and FEN–H297 distance ≥ 8 Å. For WE-HID, the three groups were defined as FEN–D147 distance ≤ 3.5 Å; FEN–H297 distance ≤ 3.5 Å; and FEN–D147 distance ≥ 8.5 Å and FEN–H297 distance ≥ 4 Å. E, F. Representative structures of the most populated clusters from the WE-HIE (E) and WE-HID (F) data defined in C and D. The FEN-D147 and FEN–H297 distances and the fentanyl ΔZ position are given.

