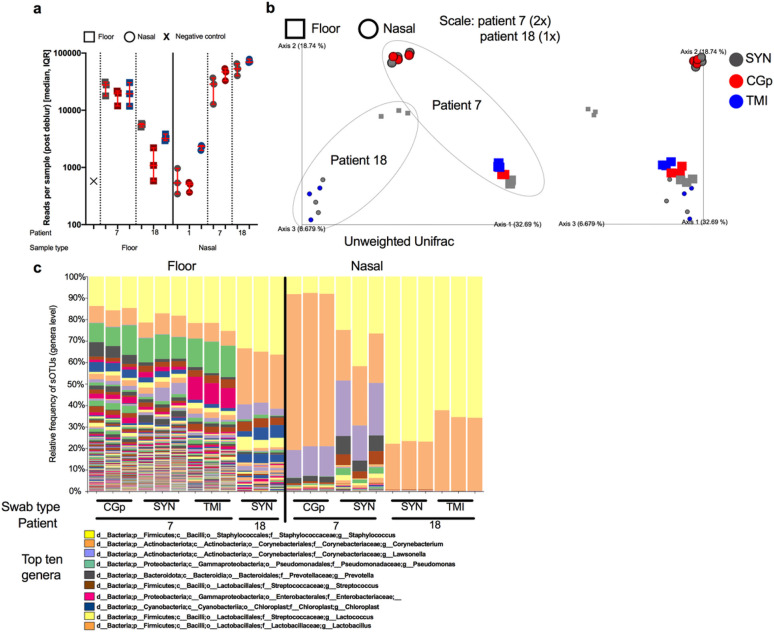
Figure 4.
Microbiome 16S rRNA sequencing validation across sample types, patients, and swab types. a) Total number of reads per sample (40 samples sequenced) after processing through deblur pipeline stratified by sample type (floor ‘square’ vs nasal ‘circle’), patient number (1, 7, and 18) and colored by swab type (SYN = grey, CGp = red, TMI = blue). Error bars represent median, IQR for triplicate biological replicates per sample. b) Unweighted UniFrac PCoA plot of samples rarified to 5000 reads. Enlarged samples (2x) indicate patient 7 whereas (1x) indicates patient 18. Swab types are colored (SYN = grey, CGp = red, TMI = blue) and shapes (floor ‘square’ vs nasal ‘circle’) indicate sample type. Grey dotted line goes around each patient. c) Stacked bar plot collapsed at genera level with top ten abundant genera labeled in the legend.

