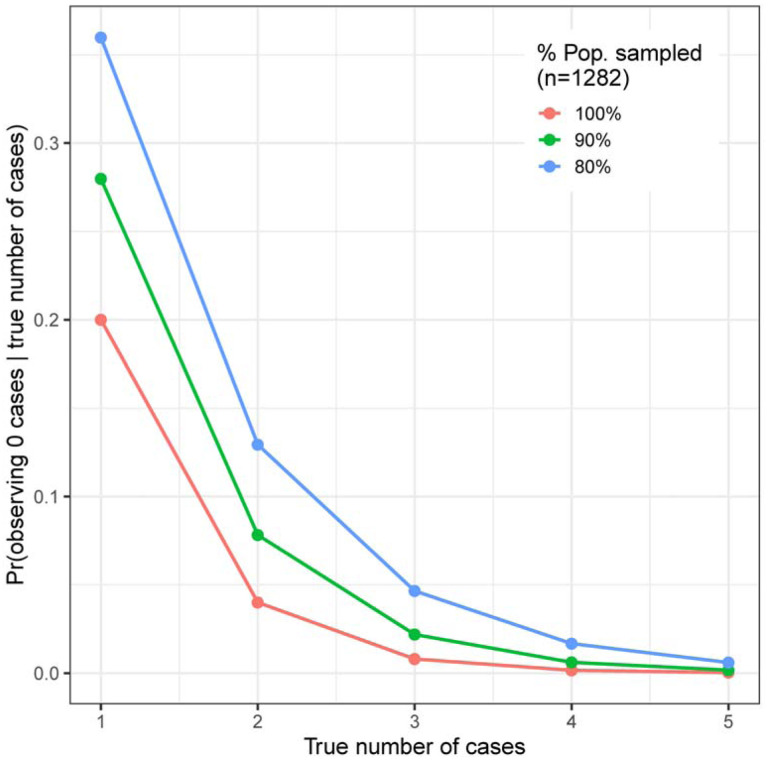
FIGURE 1:
Probability of observing 0 cases given the true number of cases (y-axis), across a range of true numbers of cases (x-axis) and the proportion of the total population that was sampled (red, green, and blue lines). For example: assuming that we had sampled the entire population (red line), the probability of observing 0 cases if there truly had been 1 case is 0.2, or 20%; the probability of observing 0 cases if there truly had been 3 cases is 0.008.

