Figure 2.

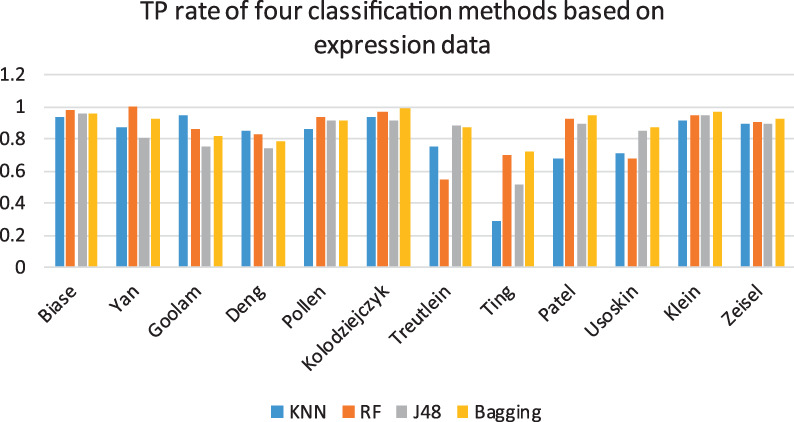
True Positive (TP) rate of four classification methods based on expression data. The blue, orange, gray and yellow bars represent the classification performance of KNN, RF, J48 and bagging, respectively.

True Positive (TP) rate of four classification methods based on expression data. The blue, orange, gray and yellow bars represent the classification performance of KNN, RF, J48 and bagging, respectively.