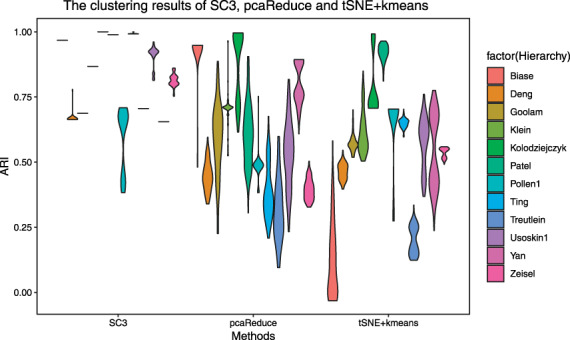
Figure 4.

The clustering results of SC3, pcaReduce and tSNE+kmeans. We use 12 colors to represent different datasets, labeled on the right side of the picture. The column of the box in the picture represents the ARI distribution. The wider the horizontal direction is, the more clustering results are distributed in the value of ARI.
