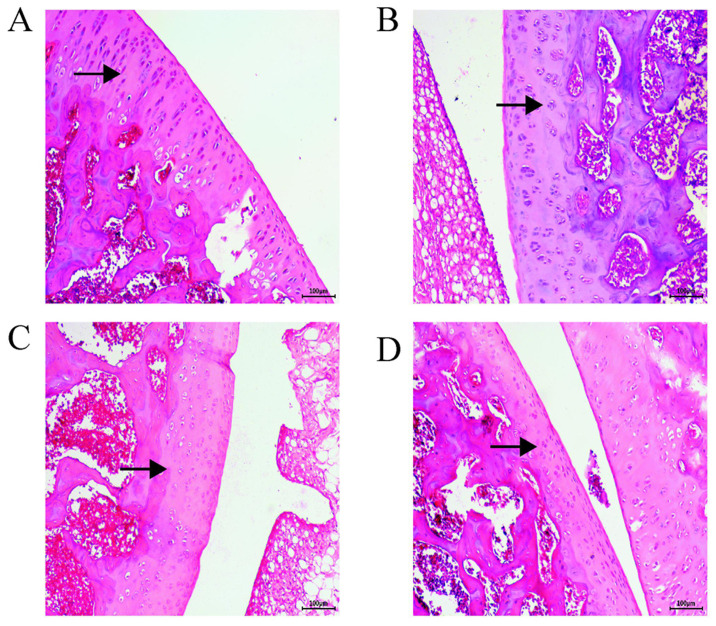
Figure 1.
Hematoxylin and eosin staining map of rat cartilage tissue sections. Cartilage matrix in the OA and the PBS groups was lightly stained; arrows indicate chondrocytes, and the cartilage matrix. In the OA and PBS groups, the cartilage was severely damaged, the cartilage layer and cell numbers were significantly reduced, and proteoglycan was lost. In the AST group, the cytoplasm and cartilage matrix were pink and evenly stained, and the chondrocytes were neatly arranged. Surface layers of the control group tissues were smoother than those of the AST group; the cartilage layer was clearly discernible and the tidal line was largely complete. Magnification, x100. (A) AST, (B) PBS, (C) OA and (D) control groups. OA, osteoarthritis; AST, astilbin.

