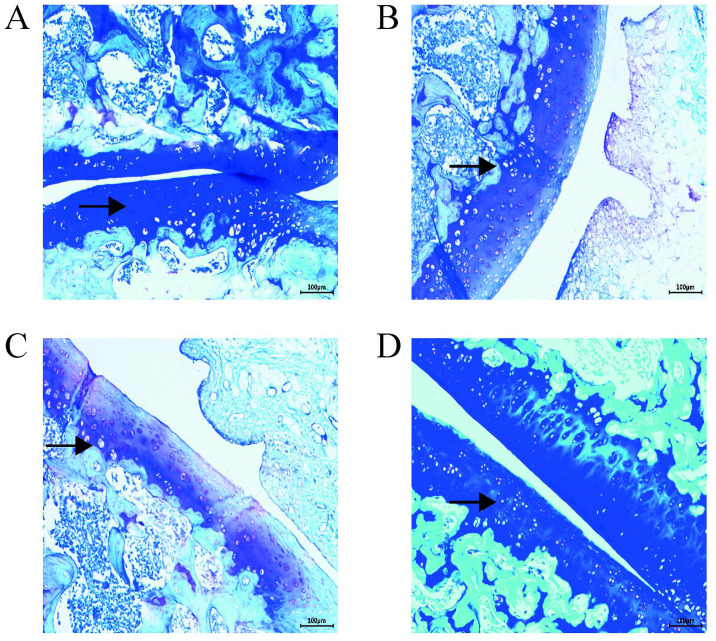
Figure 2.
Toluidine blue staining map of rat cartilage tissue sections. Cartilage tissues from the OA and PBS groups were lightly stained; arrows indicate chondrocytes. A deeper staining concentration indicates a greater ability to secrete proteoglycans and decreased cartilage destruction. Magnification, x100. (A) AST, (B) PBS, (C) OA and (D) control groups. OA, osteoarthritis; AST, astilbin.

