
Figure 4.
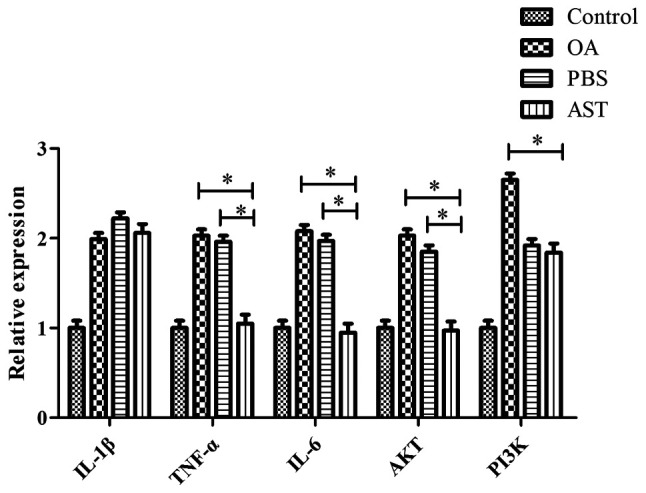
mRNA expression levels of IL-β, TNF-α, IL-6, AKT and PI3K in rat cartilage tissue sections. *P<0.05 vs. the PBS and OA groups. OA, osteoarthritis; AST, astilbin; IL, interleukin; TNF-α, tumor necrosis factor-α.
Official websites use .gov
A
.gov website belongs to an official
government organization in the United States.
Secure .gov websites use HTTPS
A lock (
) or https:// means you've safely
connected to the .gov website. Share sensitive
information only on official, secure websites.
mRNA expression levels of IL-β, TNF-α, IL-6, AKT and PI3K in rat cartilage tissue sections. *P<0.05 vs. the PBS and OA groups. OA, osteoarthritis; AST, astilbin; IL, interleukin; TNF-α, tumor necrosis factor-α.