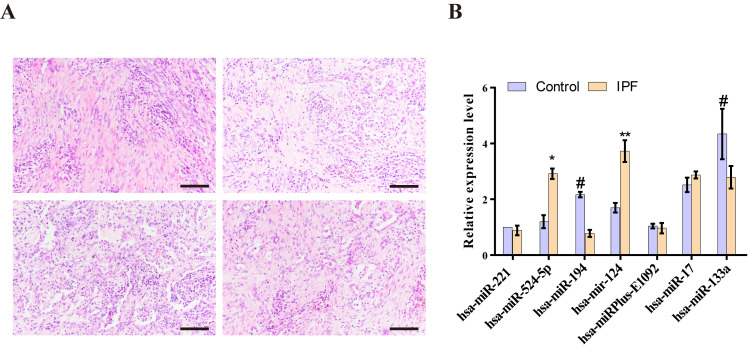
Figure 5.
Biomarkers are significantly expressed in the lung tissues of patients with IPF. (A) Representative images of hematoxylin and eosin stained lung tissues from patients with IPF; magnification, x200; scale bar, 100 µm. (B) Differentially expressed miRNAs in IPF lung tissues and control tissue were measured using reverse transcription-quantitative PCR. Data are presented as the mean ± SEM. *P<0.05, **P<0.01 vs. Control, #P<0.05 vs. IPF.

