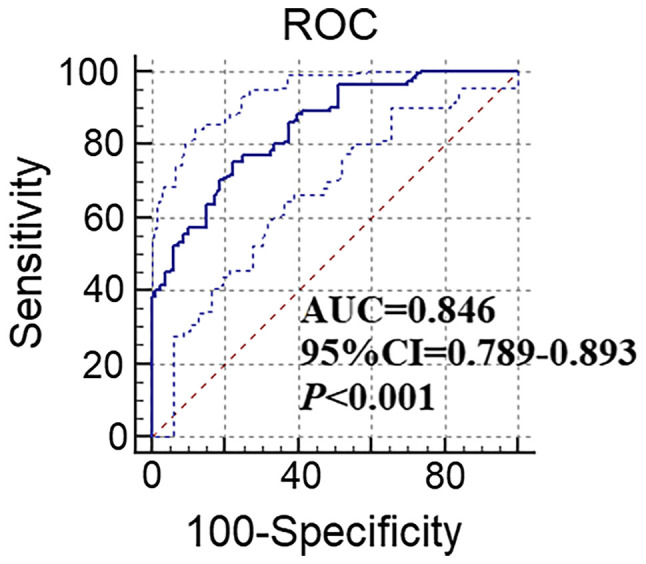
Figure 3.

ROC curve illustrating the sensitivity and specificity of peripheral natural killer cell levels at the best cutoff in diagnosing gastric cancer (P<0.001; 95% CI=0.789-0.893). The dotted curves indicate the upper and lower end of the 95% CI. ROC, receiver operating characteristic; AUC, area under the curve.
