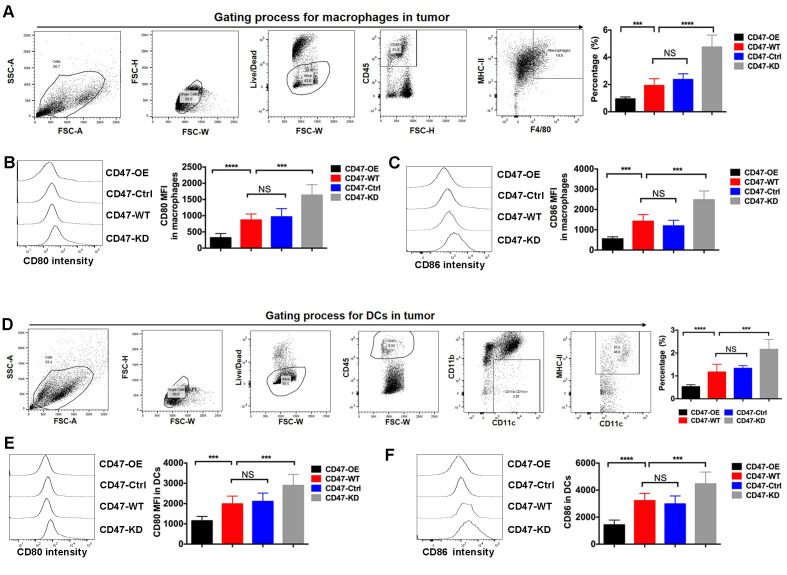
Figure 3.
CD47 overexpression inhibited antigen-presenting cell infiltration and activity in a pancreatic ductal adenocarcinoma mouse model. The mouse model was established using Panc02 cell lines with various CD47 expression levels, and the ratio of macrophages and DCs was measured by the fluorescence-activated cell sorting method. (A) The representative flow plots showed gating of macrophages in tumors. The CD47-OE tumor tissues exhibited the lowest percentage of macrophages. (B) CD80 and (C) CD86 expressed in macrophages isolated from CD47-OE tumor tissues were the lowest compared with other groups. Representative histograms of signal intensity were shown for each group. (D) The representative flow plots showed gating of DCs in tumors. The CD47-OE tumor tissues exhibited the lowest percentage of DCs. (E) CD80 and (F) CD86 expression levels were significantly reduced in the DCs isolated from CD47-OE tumor tissues. Representative histograms of signal intensity were shown for each group. ***P<0.001, ****P<0.0001. CD47, cluster of differentiation 47; MFI, mean fluorescence intensity; OE, overexpression; WT, wide type; Ctrl, control; KD, knockdown.

