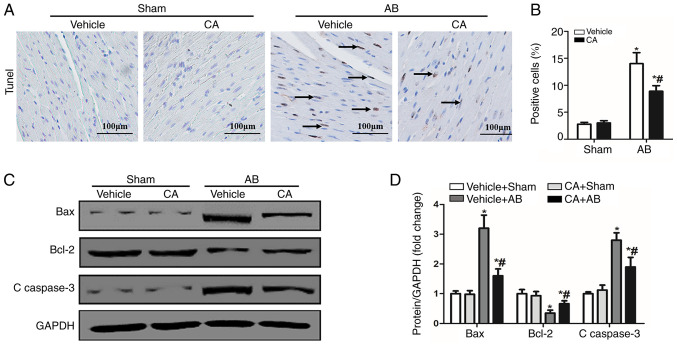
Figure 5.
CA inhibited apoptosis in mice induced by pressure-overload. (A) TUNEL staining (the arrows indicated the apoptotic cells) and (B) quantitative analysis of apoptotic cells in each group (n=15). Scale bar, 100 µm. (C) Protein levels of Bcl-2, Bax and C-caspase3 and (D) quantitative analysis are presented for each group. *P<0.05 vs. the vehicle + sham group. #P<0.05 vs. the vehicle + AB group. CA, carnosic acid; AB, aortic banding.

