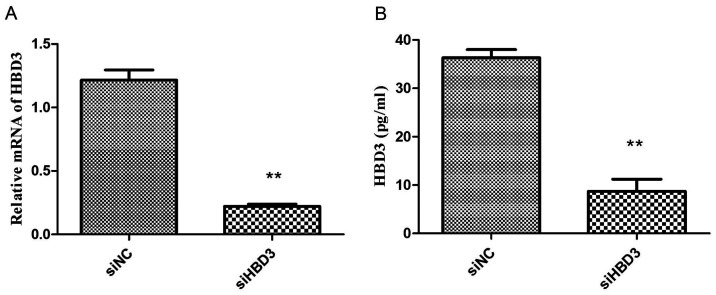
Figure 5.
The levels of HBD3 mRNA and protein. Confirmation of suppression after transfection with siRNA-HBD3 in BEAS-2B cells using real-time RT-PCR and ELISA analysis. **P<0.01, compared with the siRNA-NC group. The data are representative of three independent experiments. (A) Expression level of HBD3 mRNA. (B) Expression level of HBD3 protein.

