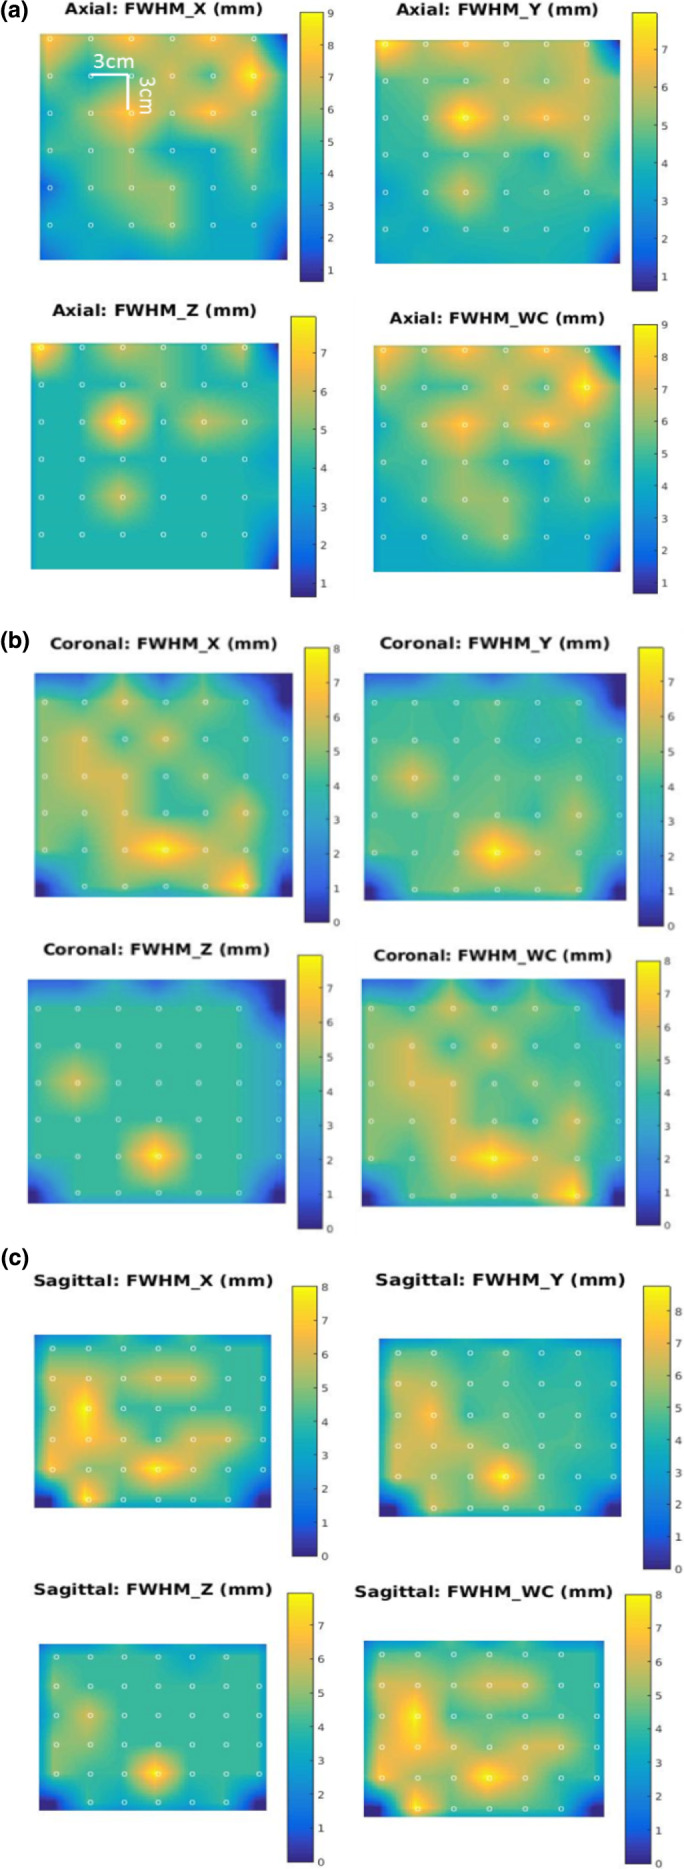
Figure 4.

Full‐width‐half‐maximum (mm) results for Rod Phantom simulations are shown for X, Y, Z and the worst case for Ell8.68mm system for the 70th iteration of reconstruction. Images show interpolated values for (a) mid‐axial slice, (b) mid‐coronal, and (c) midsagittal slices. The dots represent the acquisition points (spaced 30 mm apart in each direction). [Color figure can be viewed at wileyonlinelibrary.com]
