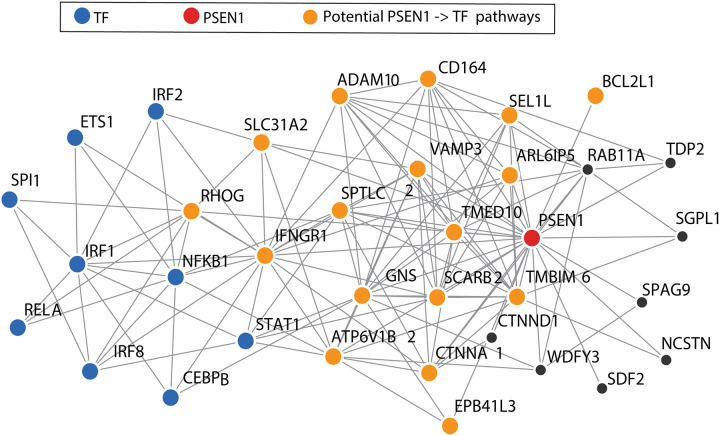
Fig 3. Developing brain-specific microglial functional network.
Developing brain-specific microglial functional network (for details see Methods) around Psen1 (red circle). Top 25 genes (orange and black circles) most closely associated with Psen1 are shown in the network. Genes connected to the TFs (orange circles) in no more than 2 steps are represented as the potential genes linking Psen1 to the TF. Only strong functional interactions (five-fold over prior) are shown in the plot.

