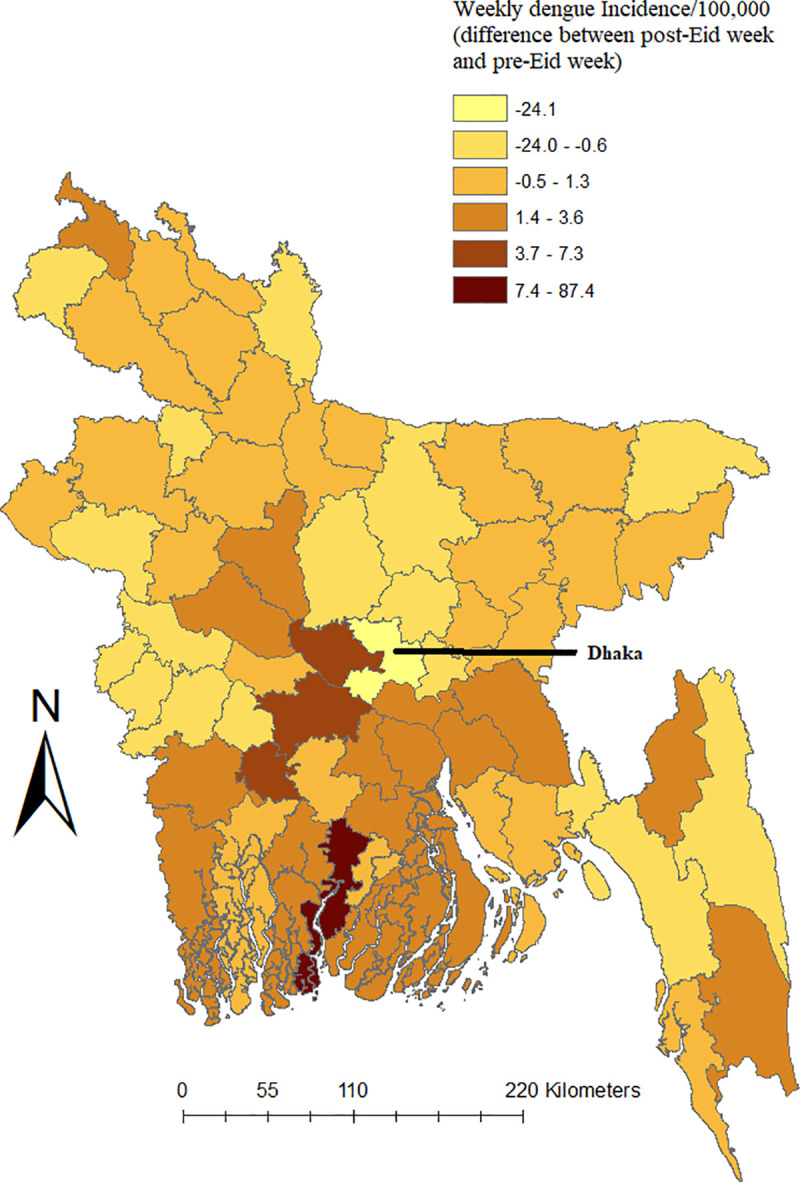
Fig 2. Spatial variation of differences of weekly dengue incidence between post-Eid and pre-Eid week in different districts of Bangladesh.

Positive and negative values in the legend represent increase and decrease of weekly dengue incidence, respectively. To calculate weekly incidence, total number of dengue cases for the week for each district was divided by the total population of the respective district and multiplied by 100,000.
