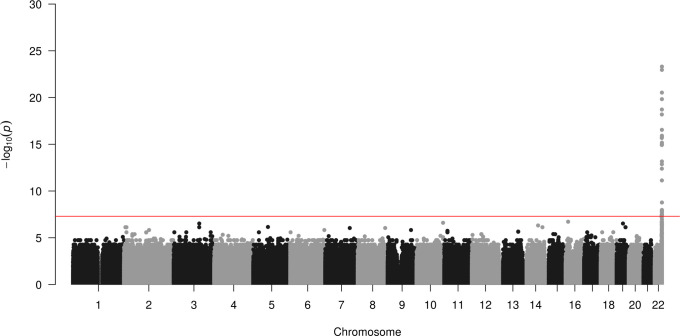
Fig 2. Integrated HHV-6A/B is associated with variants on chr22q.
Manhattan plot presenting the P values for association between a variant and integrated HHV-6 (N = 32) compared to subjects who do not carry integrated HHV-6. The −log10 P value (Fisher’s exact test) given for each variant is plotted according to the variant’s physical position on the chromosome.

