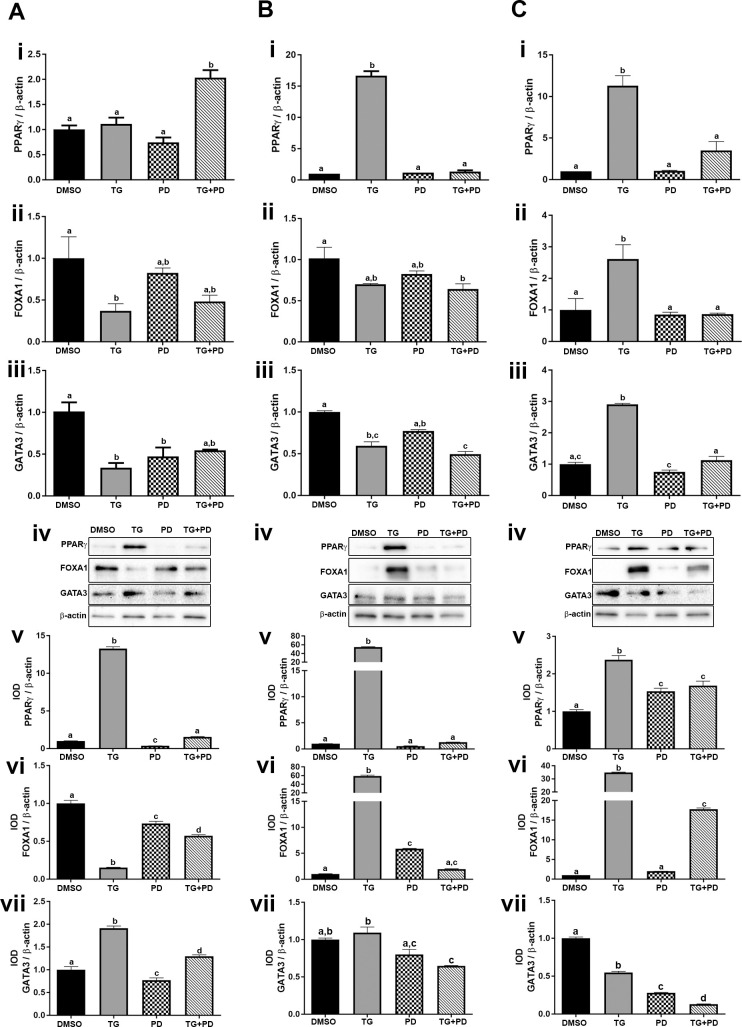
Fig 2. Expression of luminal markers in UROtsa parent and As-T cells.
The UROtsa parent (Ai-vii), As#3 (Bi-vii), and As#4 (Ci-vii) were treated with either DMSO (control), troglitizone (TG, 10 μM), PD153035 (PD, 1 μM), or TG and PD (TG+PD) for 72 hr. Real time RT-PCR analysis was performed to verify gene expression (A, B, Ci-iii). Western blot analysis was used to measure protein levels (A, B, Civ) and the integrated optical density (IOD) of each protein band was calculated (A, B, Cv-vii). Gene expression was normalized to β-actin and gene and protein are plotted as fold-change relative to the DMSO control. Amplification was below detectable levels for PPARγ in DMSO As#3, so a delta cycle threshold (ΔCt) value of 18.79 was assigned which is 0.5 higher than the highest delta Ct detected for PPARγ in that cell line. Triplicate measurements of gene and protein data were performed and are reported as mean ± SEM. Ordinary one-way ANOVA was performed followed by Tukey’s post-hoc test. Bars with differing letters indicate significant differences (p < 0.05).

