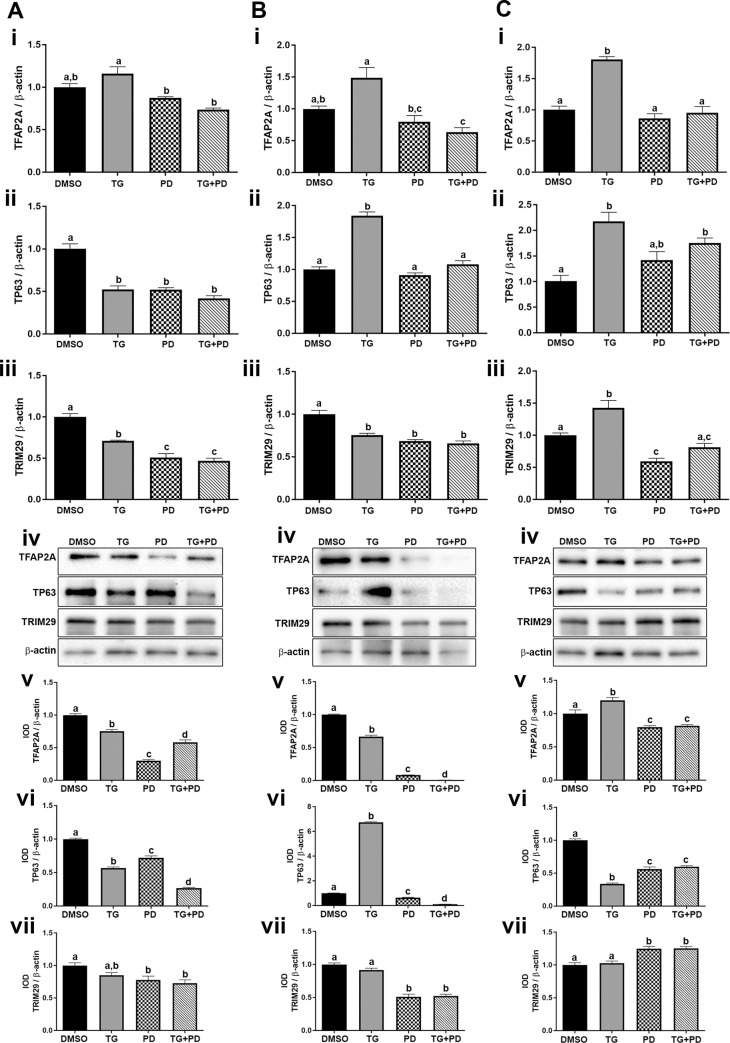
Fig 6. Expression of the transcriptional factors P63 and TFAP2A and the oncogene TRIM29.
The UROtsa parent (Ai-vii), As#3 (Bi-vii), and As#4 (Ci-vii) were treated with either DMSO (control), troglitizone (TG, 10 μM), PD153035 (PD, 1 μM), or TG and PD (TG+PD) for 72 hr. Real time RT-PCR analysis was performed to verify gene expression (A, B, Ci-iii). Western blot analysis was used to measure protein levels (A, B, Civ) and the integrated optical density (IOD) of each protein band was calculated (A, B, Cv-vii). Gene expression was normalized to β-actin and gene and protein are plotted as fold-change relative to the DMSO control. Triplicate measurements of gene and protein data were performed and are reported as mean ± SEM. Ordinary one-way ANOVA was performed followed by Tukey’s post-hoc test. Bars with differing letters indicate significant differences (p < 0.05).

