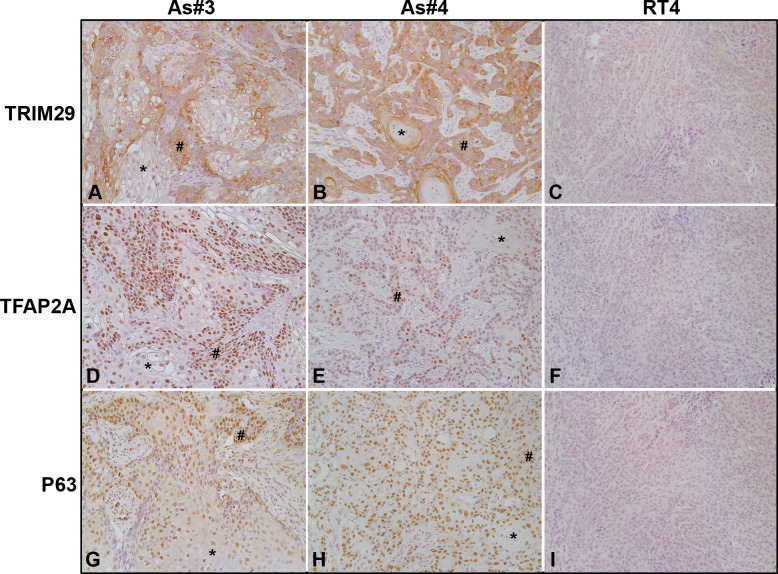
Fig 7. Immunohistochemical staining for P63, TFAP2A, and TRIM29 in tumor transplants generated from UROtsa As#3, As#4, and RT4 cells.
(A). TRIM29 in As#3. There is weak/no staining in the differentiated (*) areas in the center of the tumor nests and moderate to strong staining in the less differentiates areas (#) of the tumor transplants. (B). TRIM29 in As#4. There is moderate to strong staining for TRIM29 in the less differentiated peripheral cells (#), whereas the two keratin pearls (*) show no staining for TRIM29. (C). TRIM29 in RT4. There is weak/no staining for TRIM29 throughout the tumor. (D). TFAP2A in As#3. The staining for TFAP2A is nuclear with weak staining in the differentiated (*) areas and strong staining in the less differentiated (#) areas of the tumor. (E). TFAP2A in As#4. The staining for TFAP2A is nuclear and weak to absent in the well-differentiated cells (*) located in the center of the tumor nests, whereas the staining is moderate in the less differentiated cells (#) located at the periphery of the tumor nests. (F). TFAP2A in RT4. There was no nuclear staining throughout the tumor. (G). P63 is As#3. The staining for P63 is weak in the nucleus of well-differentiated cells in the center of the tumor nests (*), whereas the staining is moderate to strong in the nucleus of the peripheral less differentiated cells (#). (H). P63 in As#4. The staining for P63 is moderate to strong in the less differentiated cells (#) located at the periphery of the tumor nests and the differentiated cells in the center of the tumor nests (*). (I). P63 in RT4. There is no staining for P63 throughout the tumor. The brown color indicates the presence of the protein whereas the blue/purple color indicates the nuclei that are stained with the counterstain hematoxylin. All images are at a magnification of 200X.

