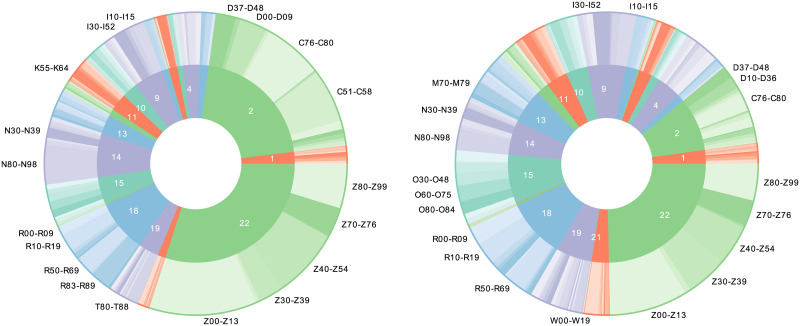
Fig 1. ICD chapters and sections for the case group and the control group.
The left part corresponds to the case group and the right part the control group. The inner circle represents the ICD chapters and the outer circle the ICD sections included in the chapter; the labels show the sections with the most frequent codes.

