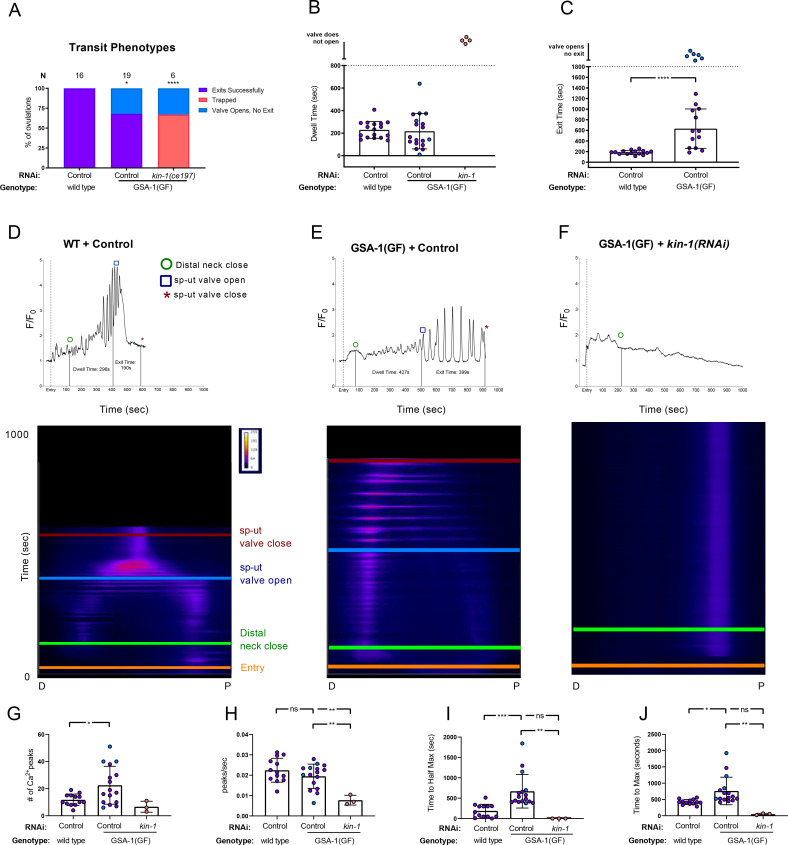
Fig 2. GSA-1(GF) induction of Ca2+ signaling in the spermatheca is dependent on KIN-1/PKA-C.
(A) Transit phenotypes of the ovulations of wild type animals treated with control RNAi, and GSA-1(GF) animals treated with control RNAi and kin-1(RNAi), were scored for successful embryo transits through the spermatheca (exits successfully), failure to exit (trapped), reflux into the gonad arm (returns to gonad arm), and the situation in which the sp-ut valve opens, but the embryo does not exit (valve opens, no exit). The total number of oocytes that exited the spermatheca successfully was compared to the sum of all other phenotypes using the Fisher’s exact t-test. Control RNAi was compared to all other RNAi treatments. Dwell (B) and exit (C) times of movies in A were analyzed using Fishers exact t-test (two dimensional x2 analysis). Color coding of the data points corresponds to the transit phenotypes in A. Representative normalized Ca2+ traces and kymograms of movies in A (D-F) are shown with time of entry, distal neck closure, and time the sp-ut valve opens and closes indicated. Levels of Ca2+ signal were normalized to 30 frames before oocyte entry. Kymograms generated by averaging over the columns of each movie frame (see methods). Refer to S3A Fig and S5A and S5B Fig for additional Ca2+ traces, and S4A Fig and S6A and S6B Fig for additional kymograms. (G-J) Color coding of the data points corresponds to the transit phenotypes in A. (G) The number of Ca2+ peaks, (H) the peaks per second, and the amount of time after oocyte entry required to reach either (I) half the maximum or (J) maximum Ca2+ signal were quantified for wild type animals treated with control RNAi, and GSA-1(GF) animals treated with control RNAi and kin-1(RNAi). These were compared using one-way ANOVA with a multiple comparison Tukey’s test. Stars designate statistical significance (*** p<0.005, ** p<0.01, * p<0.05).

