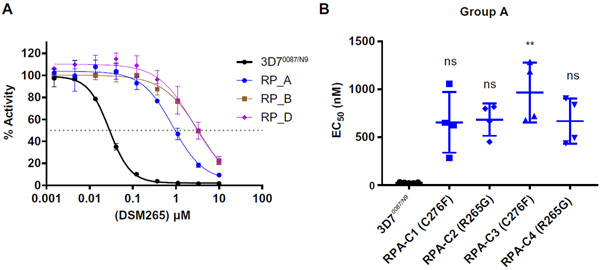
Fig. 4. Drug resistance phenotypes of parasites in P. falciparum–infected SCID mice.
(A) Resistant P. falciparum parasites (RP) from groups A, B, and D were adapted to in vitro growth and phenotyped using an in vitro dose-response assay. Shown are representative dose-response curves relative to wild-type 3D70087/N9 parasites (wild-type, black symbols; group A parasites, blue symbols; group B parasites, brown symbols; group D parasites, purple symbols). (B) Individual replicate EC50 values are shown for clonal parasite lines isolated from the group A parasite population, with error bars depicting mean and SD. Statistically significant differences in specific drug-resistant phenotypes relative to the wild-type 3D70087/N9 parental line are indicated on the graph. Significance was calculated using a nonparametric one-way ANOVA (Kruskal-Wallis) with post hoc multiple comparisons (Dunn’s test): **P < 0.01.

