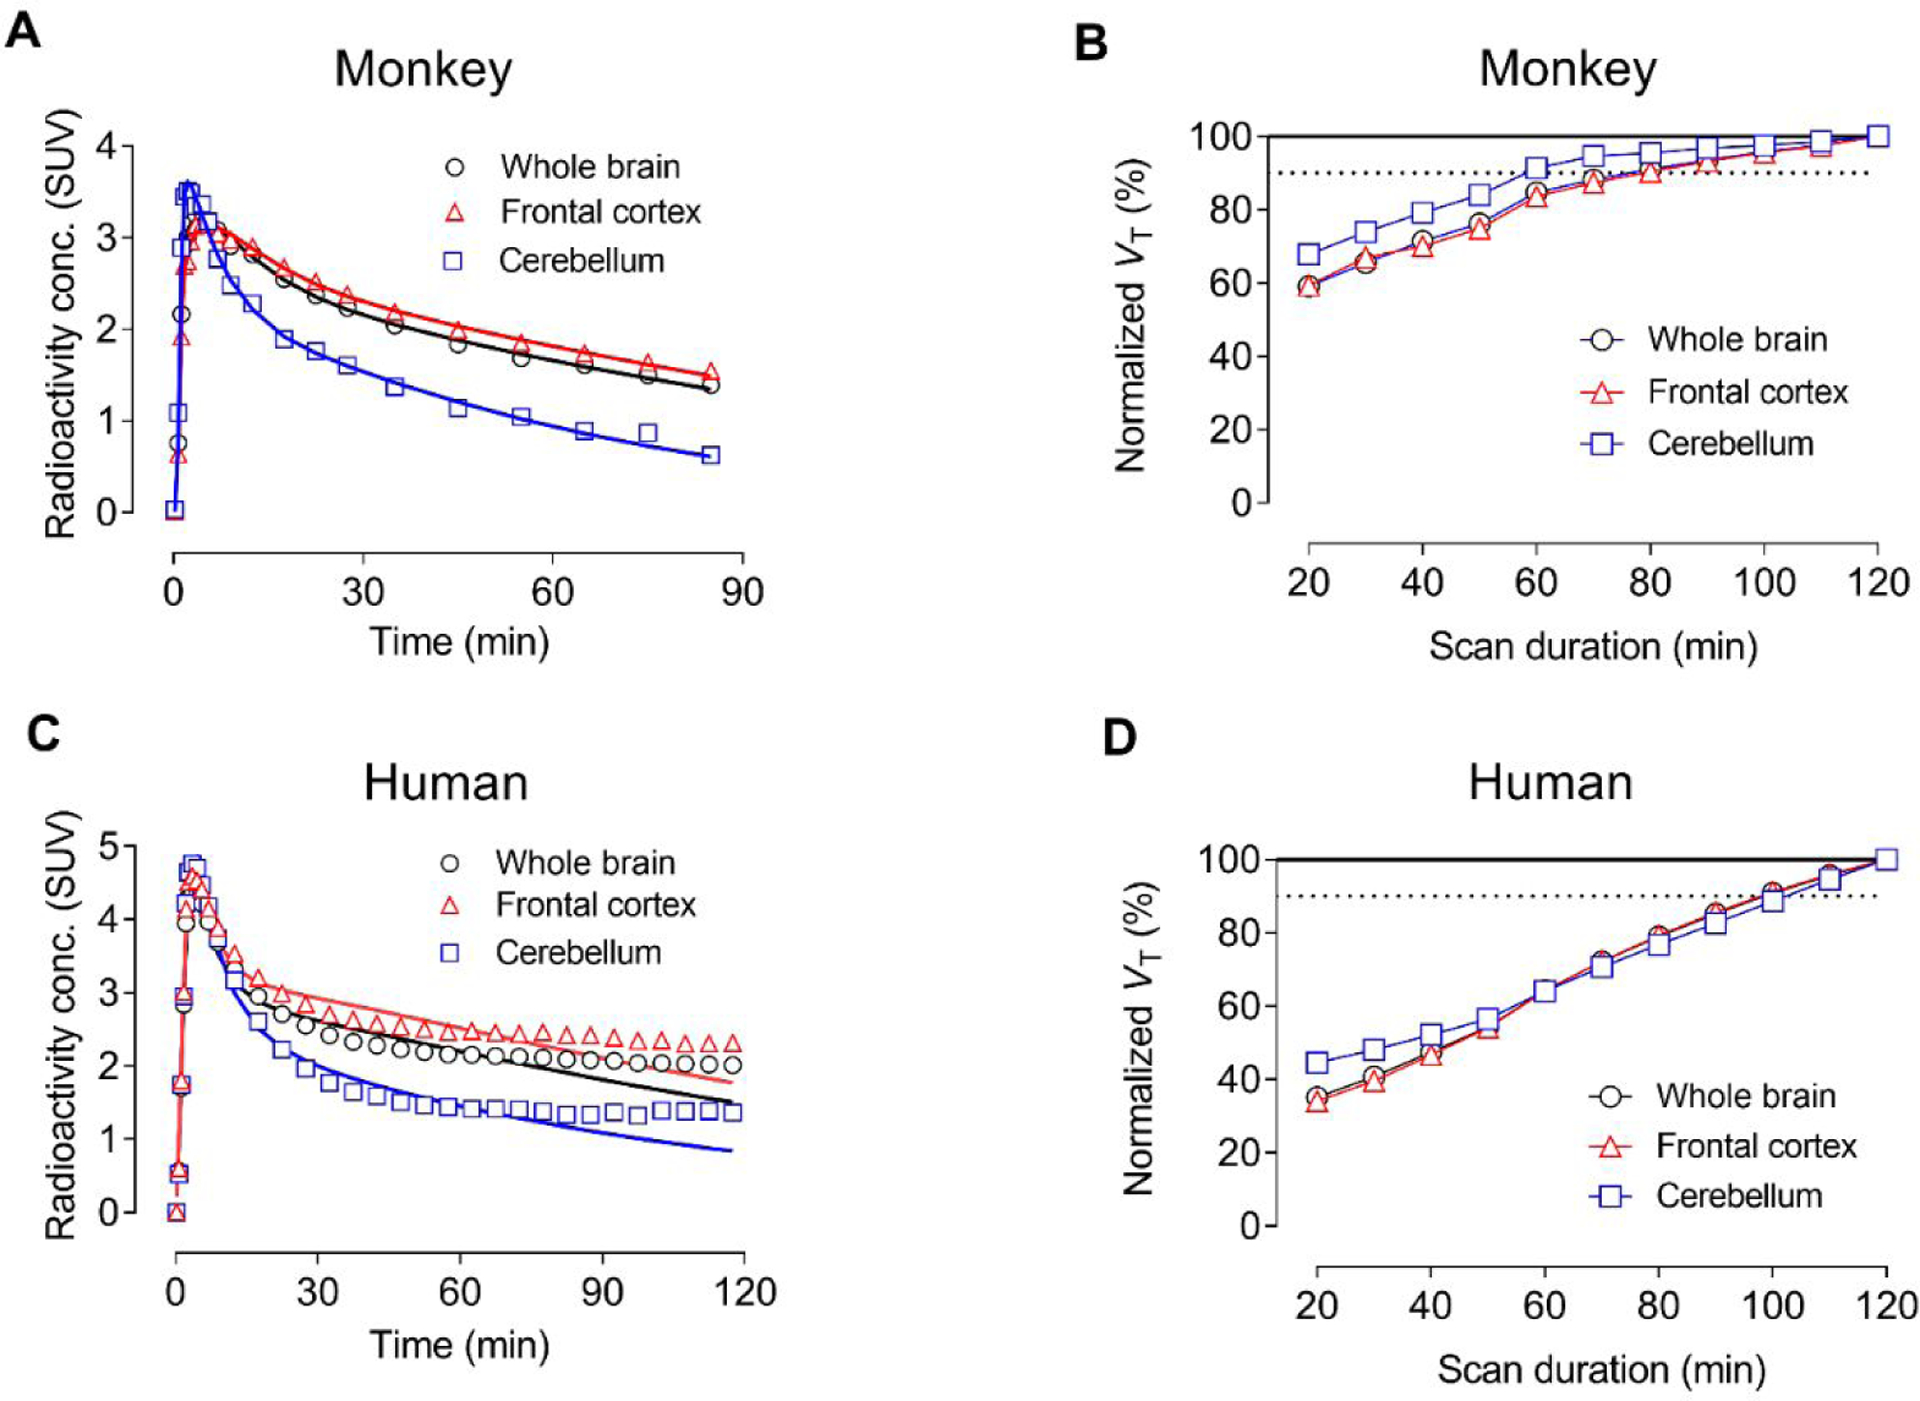
Figure 4.

Analysis of PET imaging of whole brain, frontal cortex, and cerebellum with [11C]T1650. (A) Time-activity data fitted using two-tissue compartmental modeling in monkey brain (fits are solid lines). (B) Apparent total distribution volume (VT) time-stability curves for monkey brain. (C) Time-activity data fitted using two-tissue compartmental modeling in human brain (fits are solid lines). Note: Accurate quantification of VT was complicated by the accumulation of radiometabolites in human brain. (D) Apparent total distribution volume (VT) time-stability curves for human brain. The steady increase in VT over the course of the scan is likely due to the accumulation of radiometabolite(s) both entering and forming in human brain.
