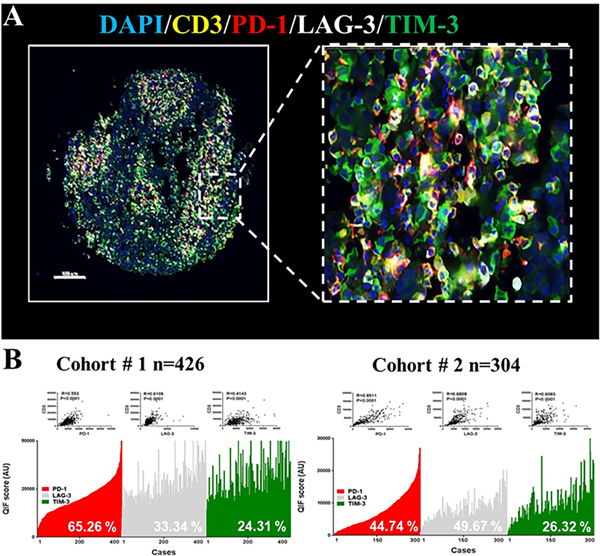
Figure 1: Distribution and frequency of T-cell PD-1, TIM-3 and LAG-3 expression in NSCLC.
A) Representative fluorescence microphotographs showing the simultaneous detection of PD-1 (red), LAG-3 (white), TIM-3 (green) and CD3 (yellow) positive cells in NSCLC. B) Level of the markers measured using QIF in 2 retrospective NSCLC cohorts- Cohort #1 [n=426] (A) and #2 [n=304] (B). The markers were measured in CD3+ T-cells and showed a continuous distribution and strong association with CD3 (insets). The frequency of expression of each marker is indicated with white-colored text within the charts. R= Spearman’s correlation coefficient.

