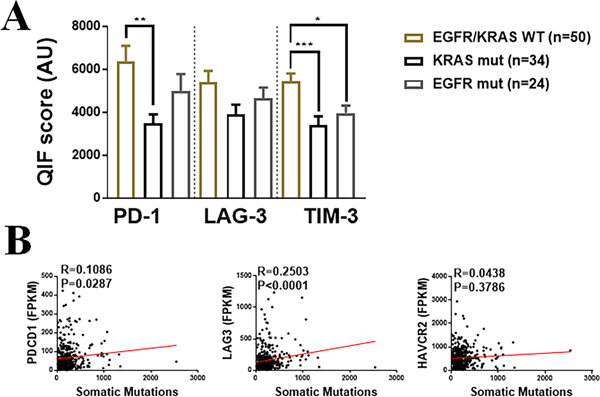
Figure 4. Association of LAG-3, PD-1, TIM-3 and CD3 with major driver mutations and tumor mutational burden in NSCLC.
A) Levels of PD-1, LAG-3 and TIM-3 in lung adenocarcinoma cohort #3 comprising cases wildtype for EGFR and KRAS driver mutations and with oncogenic KRAS or EGFR variants. B) Association between the markers mRNA levels (FPKMs) and tumor mutational burden (e.g. number of nonsynonymous mutations) in the TCGA NSCLC cohort (Cohort 3, N=406) *=P<0.01; **=P<0.01, ***=P<0.001. R=Spearman’s correlation coefficient.

