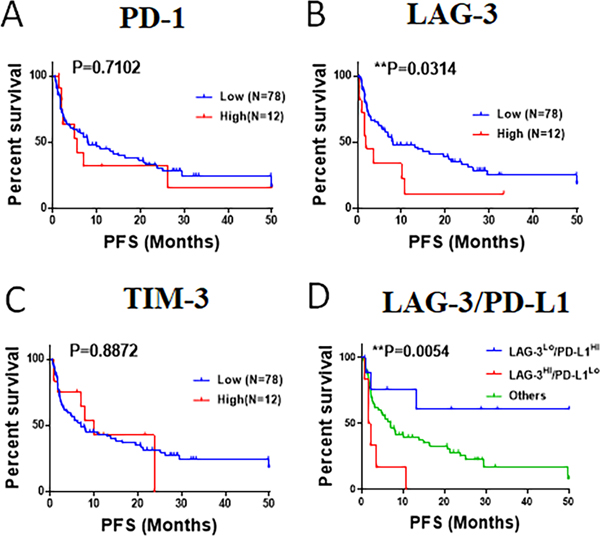
Figure 6. Association of PD-1, LAG-3 and TIM-3 expression with survival in NSCLC patients treated with PD-1 axis blockers.
(A-C): Charts showing the Kaplan-Meier survival estimates of patients treated with PD-1 axis blockers (cohort #6, n=90). The scores of T-cell PD-1 (A), LAG-3 (B) and TIM-3 (C) were measured using multiplex QIF in pre-treatment samples and stratified using top 15th percentile as cut-point. The differences between groups was compared using the log-rank test. D) Kaplan-Meier survival estimates of patients treated with PD-1 axis blockers stratified by LAG-3 expression (high, above top 15th; low, below or equal top 15th) and PD-L1 expression (high, above 50% tumor proportion score; low, below or equal 50% tumor proportion score).

