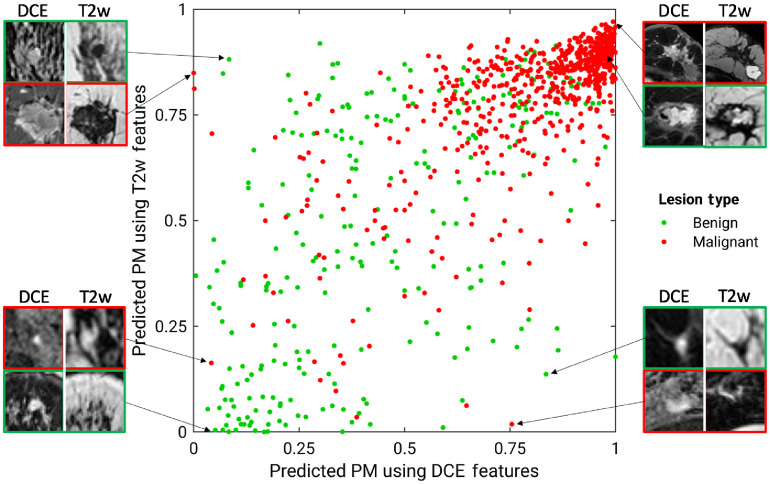
Fig. 2.
Diagonal classifier agreement plot between the T2w and DCE single-parametric classifiers. The axis and axis denote the PM scores predicted by the classifiers using DCE and T2w features, respectively. Each point represents a lesion for which predictions were made. Points along or near the diagonal from bottom left to top right correspond to high classifier agreement; points far from the diagonal correspond to low agreement. Examples of lesions on which the two classifiers were in extreme agreement/disagreement are also included. Disagreement: lower right benign: papilloma; lower right malignant: mixture of invasive ductal carcinoma and ductal carcinoma in situ, HER-2 enriched; upper left benign: fibroadenoma; upper left malignant: mixture of invasive ductal carcinoma and ductal carcinoma in situ, luminal A. Agreement (both incorrect): upper right benign: hyalinized stromal fibrosis; lower left malignant: ductal carcinoma in situ. Agreement (both correct): upper right malignant: mixture of invasive ductal carcinoma and ductal carcinoma in situ, triple negative, very large; and lower left benign: fibroadenoma.

