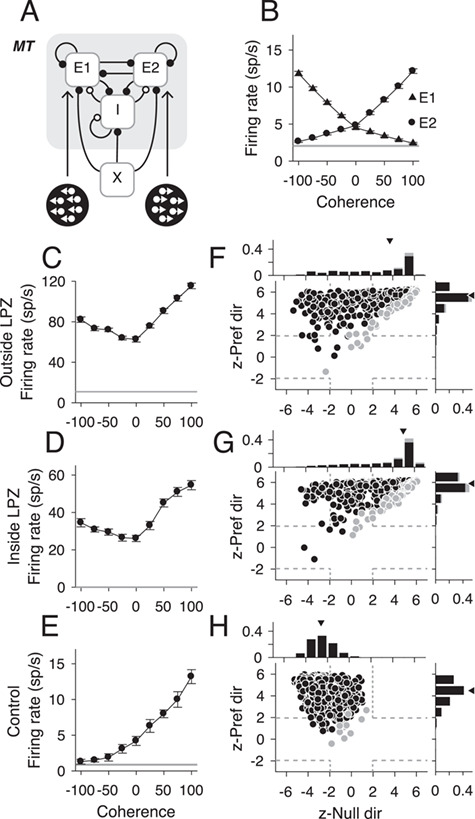
Figure 7.

Responses to motion coherence in an imbalanced network model. (A) Schematic of network model for an MT-like circuit composed of 2 populations of excitatory neurons (E1, E2) tuned to opposite directions of motion and reciprocally connected inhibitory (I) neurons. Each population receives an external Poisson signal (X). (B) Population mean firing rates for E1 neurons (triangles, n = 800) and E2 neurons (circles, n = 800) in response to varying motion coherence in 2 directions. Gray line indicates mean spontaneous rate; error bars indicate standard error. (C–E) Neural responses from 3 example units (inside the LPZ, outside the LPZ, and control, respectively) that showed typical responses for each population to motion coherence. Stimulus motion in the preferred direction is indicated by positive coherence values and in the null direction by negative coherence values. Average spontaneous firing rate indicated by horizontal black lines. Error bars indicate standard error. (F–H) Scatter plots of z-scored firing rates for all visually responsive neurons from populations E1 and E2 for each population (Outside LPZ, n = 530; Inside LPZ, n = 679; and Control, n = 1579, respectively). For all scatter plots, the y-axis shows the z-score for the firing rate difference between a stimulus with 100% coherence in the preferred direction and a stimulus with 0% coherence. The x-axis shows the z-score for the firing rate difference between a stimulus with 100% coherence in the null direction and a stimulus with 0% coherence. Each circle represents one simulated neuron. Darker circles indicate direction selective neurons; lighter circles indicate non-direction selective neurons. Squares indicate example neurons shown in C–E; dashed gray lines indicate the significance threshold for each z-score (+/−1.96). Histograms show the distribution of z-scores for each axis. Triangle indicates median z-scores.
