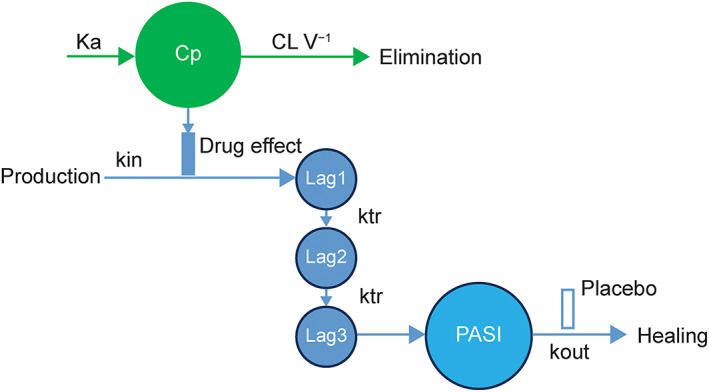
FIGURE 1.

Longitudinal pharmacokinetic–pharmacodynamic model. CL V−1, clearance over volume; Cp, predicted concentration–time course from the population pharmacokinetic model using post hoc parameters; ka, absorption rate constant; kin, zero‐order constant for production of the response; kout, first‐order rate constant for loss of the response; ktr, transit rate constant; Lag1–3, PASI transit compartments 1–3; PASI, Psoriasis Area and Severity Index
