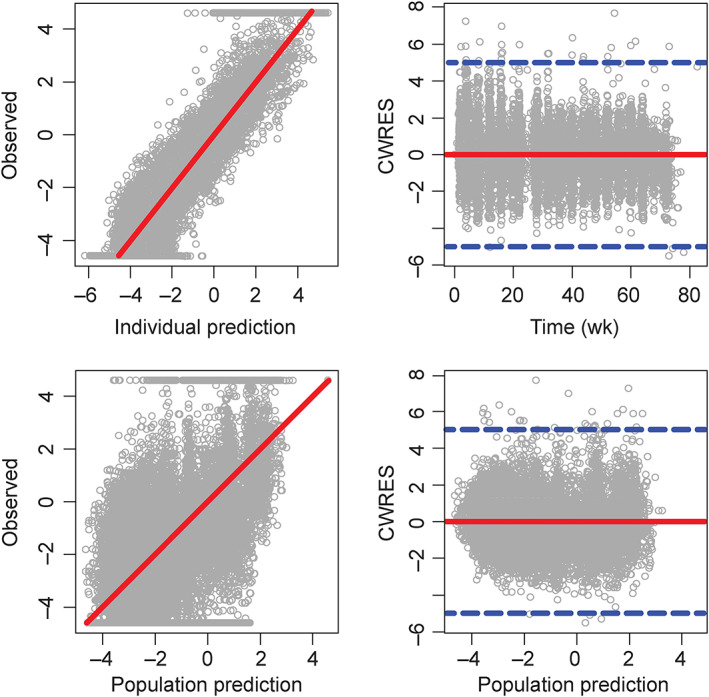
FIGURE 3.

Goodness‐of‐fit plots for the final pharmacokinetic–pharmacodynamic model. Circles are individual observed values; solid red lines are either lines of unity (left panels) or zero horizon lines (right panels). Blue dashed lines at the right panels indicate conditional weighted residuals (CWRES) equal to −5 and + 5. Observed, individual, and population prediction Psoriasis Area and Severity Index (PASI) scores shown in the plots were transformed as PASI/(100 − PASI)
