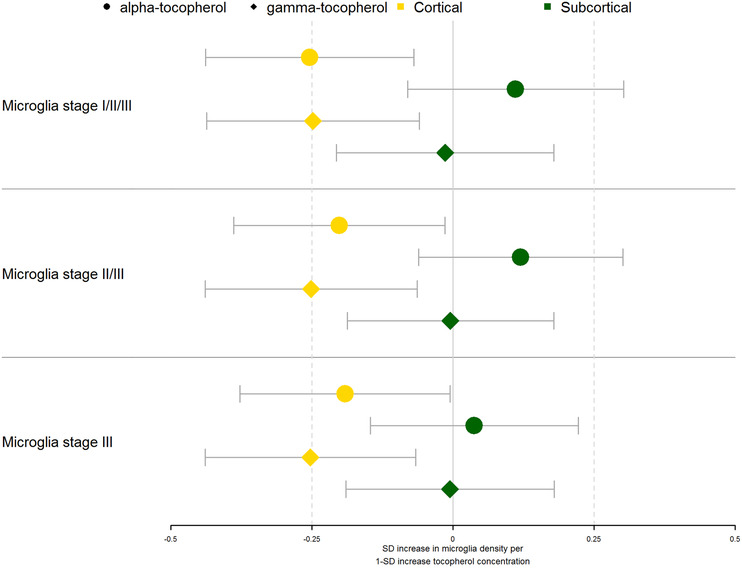
FIGURE 2.

Associations of brain tocopherol levels with microglia density. The standardized effect estimates on microglia density of brain tocopherols adjusted for age, sex, education, post‐mortem time interval, and APOEε4 genotype (any ε4 allele vs. none) are shown. The estimates are shown for α‐tocopherol (circles) and γ‐tocopherol (diamonds) by region (cortical = yellow, subcortical = green). Point estimates are shown as boxes with whiskers denoting the 95% confidence interval of the effect estimates. SD, standard deviation
