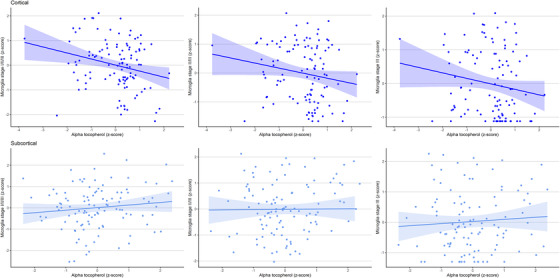
FIGURE 3.

Scatterplots of the associations of α‐tocopherol levels with microglia density. The upper graphs in dark blue depict the associations in the cortical brain regions, whereas the lower graphs in light blue depict the associations in the subcortical brain regions. Microglia density and α‐tocopherol levels are shown as log‐transformed z‐scores
