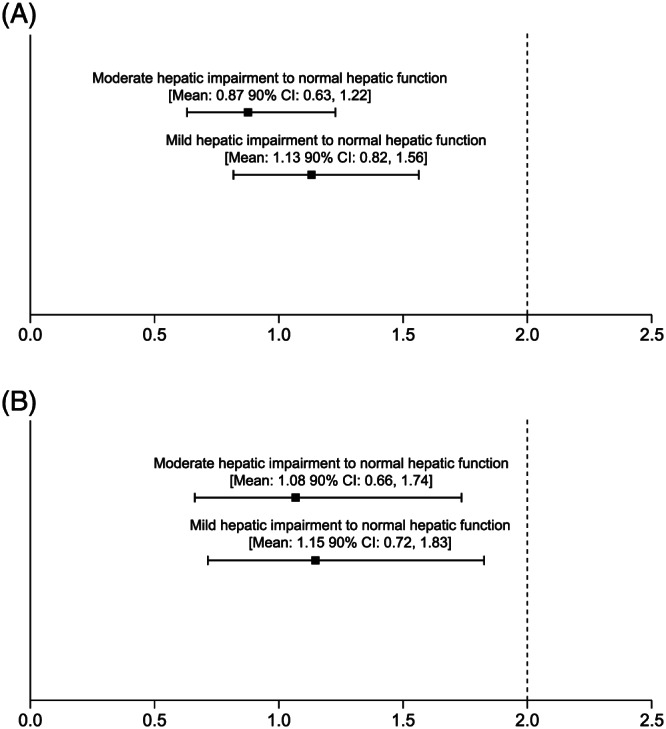
FIGURE 2.

Geometric least‐squares mean ratios (90% confidence interval [CI]) for (A) maximum plasma concentration and (B) area under the plasma concentration–time curve from zero extrapolated to infinity in patients with mild or moderate hepatic impairment vs those with normal hepatic function following a single dose of olaparib 300 mg (tablet formulation)
