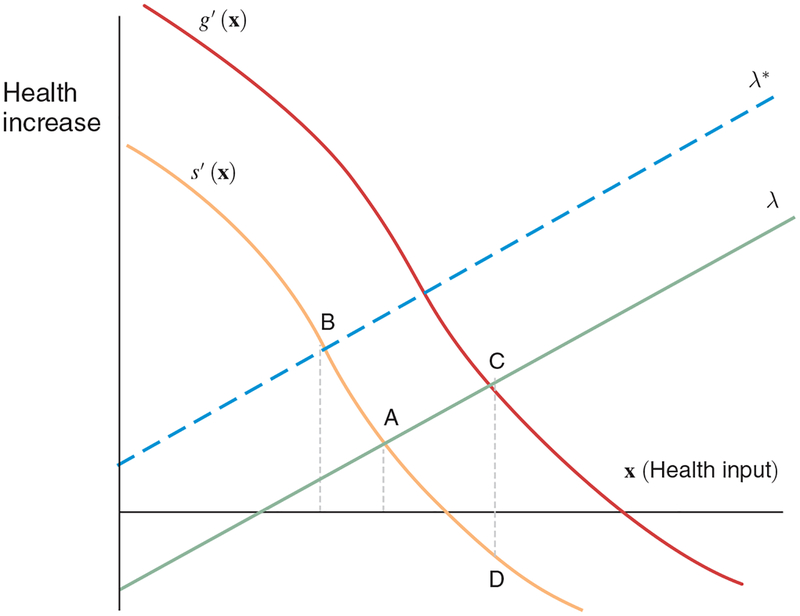
Figure 1.
Theoretical Model of Equilibrium Health Care Intensity
Notes: The model that corresponds to this figure is presented in detail in online Appendix A. The curves s’(x) and g’(x) represent two distinct marginal benefit curves—either real or perceived. The lines λ* and λ represent two different sets of constraints. In the model, physicians assess the expected marginal benefit of treatment and the constraints that they face and deliver care up to the point where the two curves intersect.

