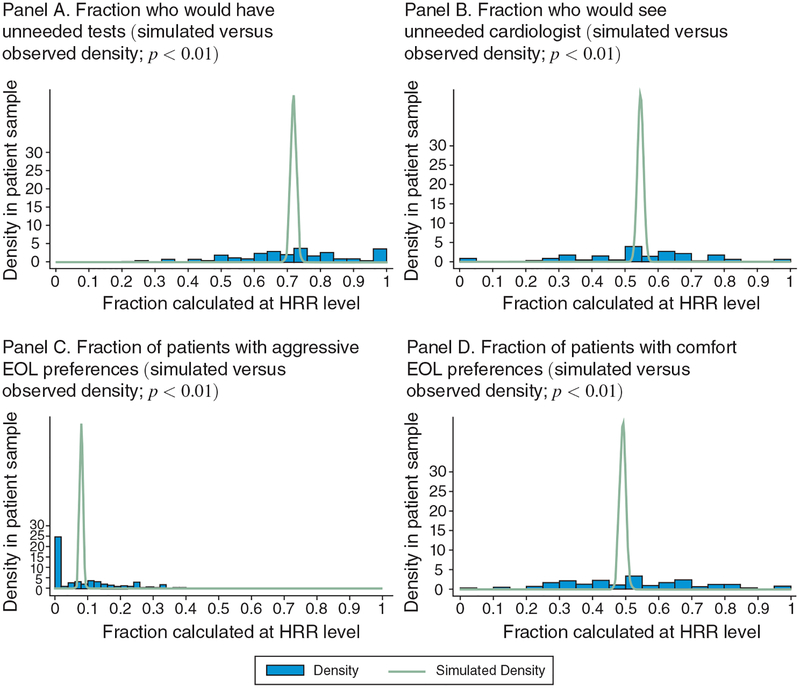
Figure 2.
Distributions of Observed Patient Preferences versus Simulated Distributions (based on 1,000 bootstrap samples with replacement)
Notes: This figure shows density plots of patient preferences for the main questions in the patient survey for the 74 HRRs considered (weighted by observations per HRR). A simulated distribution based on 1,000 bootstrap samples under the null hypothesis that individuals were randomly assigned to areas is superimposed on the observed distributions. p-values for over-dispersion are reported in Table 1 and indicate that the observed variation is significantly greater than can be explained by random variation.

