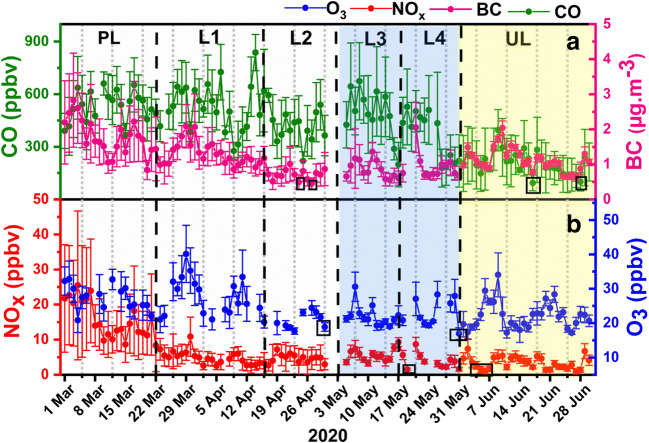
Fig. 5.
Temporal variation of a CO and BC b NOx and O3 during pre-lockdown, lockdown 1.0, lockdown 2.0, lockdown 3.0, lockdown 4.0, and unlock-1 (March–June 2020) at Bhubaneswar. The blue-coloured background portion represents imposition of night curfew between 7 PM and 7 AM while the yellow-coloured background portion represents imposition of night curfew between 9 PM and 5 AM.The small boxes represent minimum concentration gases observed during the study period

