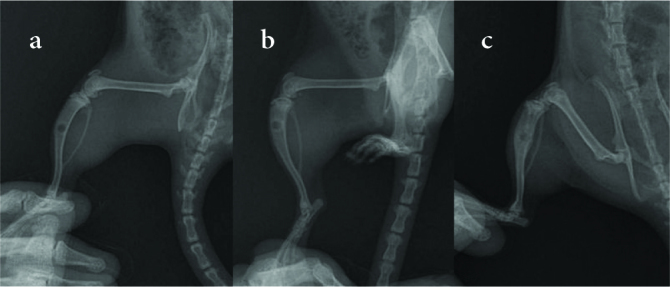
Figure 7. a–c.

Sample radiographs of (a) the untreated group (Group A), (b) the treatment group with blank implants (Group B), and (c) the PDGF-releasing implant group (Group C)

Sample radiographs of (a) the untreated group (Group A), (b) the treatment group with blank implants (Group B), and (c) the PDGF-releasing implant group (Group C)