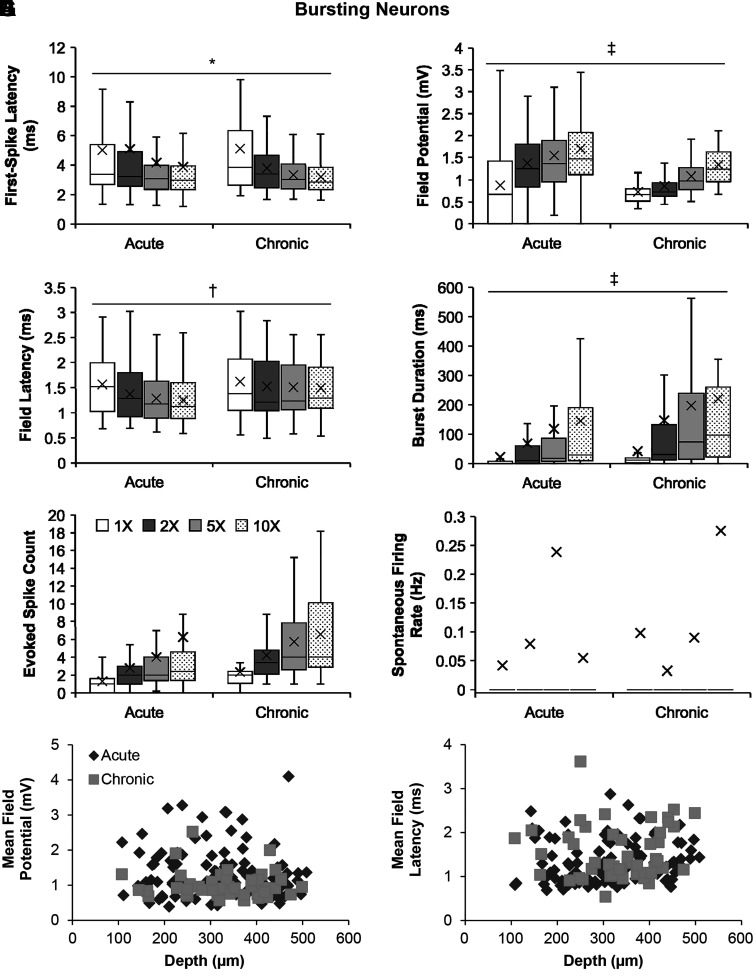
Fig. 1.
Comparisons of the firing properties of the bursting neurons following acute and chronic spinal transection. A–F: group data comparing firing properties (mean marked by X) of the bursting neurons following acute and chronic spinal transection in response to increasing stimulus intensity in control. A: first-spike latency (only nonzero values) for acute (n = 64, 1×; n = 92, 2×; n = 96, 5×; n = 94, 10×) and chronic (n = 49; except n = 46 at 1×) spinal transection. B: field potential for acute (n = 96; except n = 95 at 10×) and chronic (n = 49 for all intensities) spinal transection. C: field latency (only nonzero values) for acute (n = 65, 1×; n = 93, 2×; n = 96, 5×; n = 94, 10×) and chronic (n = 49 for all intensities) spinal transection. D: burst duration for acute (n = 96; except n = 95 at 10×) and chronic (n = 49 for all intensities) spinal transection. E: evoked spike count for acute (n = 96; except n = 95 at 10×) and chronic (n = 49 for all intensities) spinal transection. F: spontaneous firing rate for acute (n = 96; except n = 95 at 10×) and chronic (n = 49 for all intensities) spinal transection. G and H: distribution comparisons between the bursting neurons following acute (n = 96) and chronic (n = 49) spinal transection as plots of mean field potential (G) and field latency (H) against depths measured from the dorsal surface. Significant difference (*P < 0.05; †P < 0.01; ‡P < 0.001) using a two-way unbalanced ANOVA is shown. The box and whisker plots show the minimum, first quartile, median, third quartile, and maximum, without outliers.

