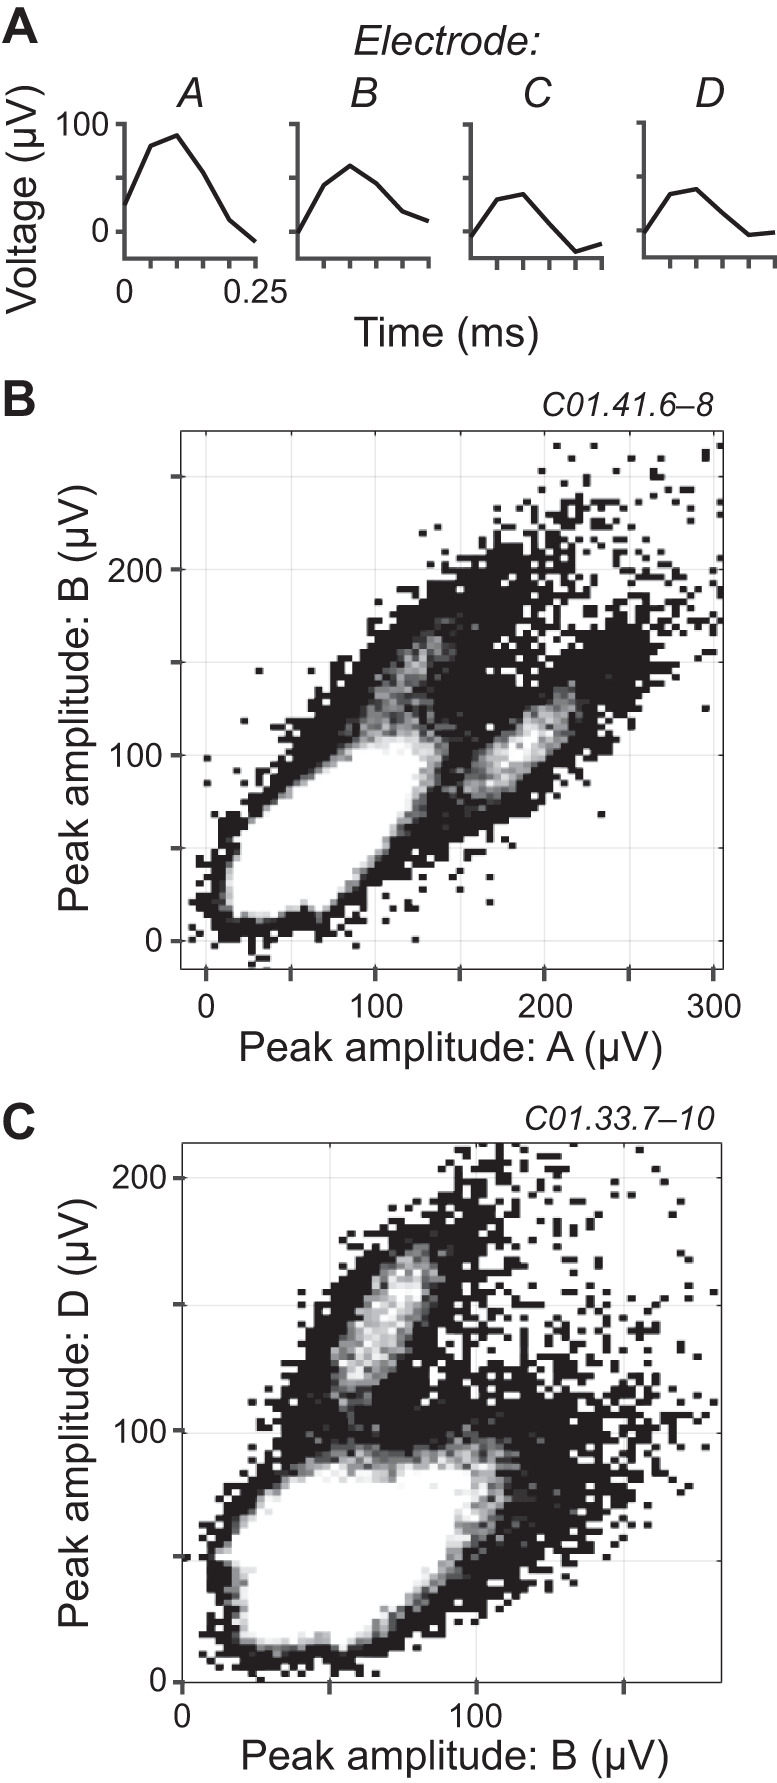
Fig. 1.

Spike sorting. A: example of voltage trace windows simultaneously captured across electrodes A–D within a tetrode in response to a threshold-crossing event. B and C: 2-dimensional histograms of the peak voltage amplitudes of threshold-crossing events for 2 electrodes within a tetrode. Data in B and C are from different experimental sessions (labels at top right). Grayscale indicates number of occurrences, with white being the greatest. Multiunit clusters are at bottom left. The color white was set to a value lower than the maximum number of occurrences so that the smaller single-unit clusters could be visualized.
